
One of the biggest challenges building product manufacturers struggle with is having an effective, multi-channel marketing strategy. The complexity of the commercial construction industry has been underestimated as far back as I can recall and seems to be multiplying. For BPMs, the complexity is the highest it’s ever been. For most BPMs to realize sustained success, creating and maintaining a combination of strategic and tactical approaches with the entire building team is essential.
Building product manufacturers can vary significantly in their products. However, no matter what you make, or the size of your revenue footprint, there are shared fundamentals relevant to all BPMs. We share the same disciplines: engineering, IT, HR, finance, manufacturing, distribution, procurement, marketing, sales, etc. The two disciplines that we will focus on in the next two installments of this series are marketing and sales and how data analytics can improve those areas
Marketing: The marketing function is probably one of the most misunderstood and underdeveloped in the BPM space. Given that most of us work in small to medium-sized companies, resources are precious, yet, for some reason, the marketing department often becomes something less than it should be, only limited to graphic design, website maintenance, etc.
In the academic sense, marketing should be the strategic conscience of the BPM enterprise, leading the way in market analysis and research, identification of sales channels and processes, product development, maintenance/management, branding, and communications. The most incredible tool in the marketing department is continuous market analysis of their products.
Market Analysis: Market analysis is critical in assessing the potential market size for the manufacturer’s current and future products, setting baseline models for market penetration, sales and sales partner allocation, and performance measurement. This assessment is done by using quantitative and qualitative data types.
Simply defined, the quantitative data set will tell us how much, how many, and the level of frequency or how often, and the qualitative data set will provide us with the who, what, and where. (Generally speaking, if it’s a number, it is quantitative, and if it’s a noun, a person, place, or thing, it’s qualitative. Knowing these two terms can set us up to build our models.)
The Value of Having Quantitative Data—Analyzed Thoroughly
For this segment, I will focus on the value of quantitative data, how to acquire it, and build applicable models for your company. We can chart trends, ours, and the industry’s with the right data product. Also, with the right quantitative data product, we can assess sales potential.
A priority is to determine your place in the industry. To assess sales trends as compared to the industry, your sales data needs to be compared in either monetary value or another unit of measurement, such as linear feet or weight. (Most manufacturers use dollars since we generally do not record sales in the other units of measurement. The key is consistency and availability in which unit types are used.)
External data sources are necessary to compare our sales to the broader construction industry metrics and market and will be needed for quantitative and qualitative analysis. For our first focus of performing quantitative analysis, we have choices of data series, the most popular being: 1. Construction Starts, and 2. Construction Put in Place.
Construction Starts (quantitative data): The definition of a construction start is when the shovel is in the ground and foundations are ready to be poured. This data is represented in the number of units, value, and square footage, and is segmented by project type, this data is available from ContructConnect.
Construction Put in Place (quantitative data): is an estimate of projects that are assumed to be completed. Like ConstructConnect’s Starts series, the ConstructConnect PIP data now includes Canadian and U.S. national scope down to the state and county levels, which widens geographic analysis possibilities over the U.S. Census Bureau data, which only has minimal geographic pliability. PIP products can be acquired through ConstructConnect, the U.S. Census Bureau, and others.
There are advantages of Starts data over PIP data for the BPM. Contrary to PIP, starts data provides the BPM with many more strategic forecasting options. Given that a construction start can be recorded many months to even years before breaking ground (and depending on the project type and size), this data series can be used to measure product potential or demand, market share, and sales performance down to sales regions and territories, because it is available at the county level.
Note that because of the lag in time between a start and the project being put in place (or as turnkey, handed over to the owner), the Starts series can also forecast raw material purchases, headcount, and inventory. Starts combined with other supply chain applications are helpful for application in sales & operations planning exercises.
Quantitative Analysis Interpreting Sales Vs. Industry Trend
As I stated before, many of the manufacturers that I have worked with over the years do not even use analytics at its most rudimentary level, but why? Is this because they do not understand or appreciate the significance of knowing market share? Is this because they do not have or know how to acquire the tools and data to complete their market share analysis?
We need to know how we are tracking according to trends in our industry:
- Are sales of my products keeping with an upward trend?
- Can we explain our slowed sales due to an overall industry downward trend?
Equally important is knowing what percent of the industry sales is owned by us versus our competitors. In marketing and sales, our initial BPM question is, “How are we tracking in the U.S. construction industry?” Below, I cite a case study to exemplify the importance and help understand market analysis to determine our position within the industry trend. It is not just watching sales revenue increase year after year.
A Case Study with Actionable Examples
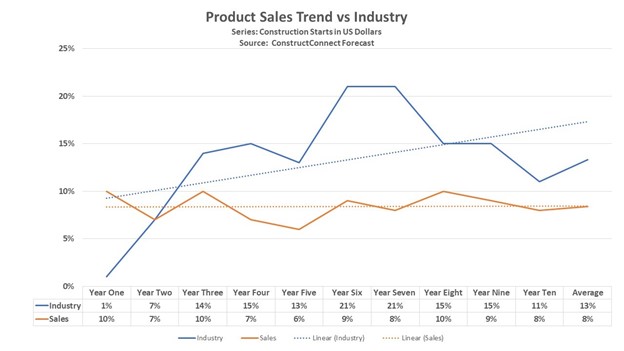
As a prior BPM executive, my company had historically enjoyed a dominant position in the single-product hardware category. Our growth in the ten years from 1990 to 2000 increased some 13%. If you are old enough to remember or studied economics in college, the decade of the 1990s was one of the most significant economic expansions in U.S. history.
We were proudly standing tall after a decade of double-digit growth. Still, upon my deeper analysis, using construction starts data to peg how we were doing against our industry, I discovered we had lost a significant share, mainly at the tail end of the decade, as illustrated below.
This realization led us to find out why: In surveying our distributor customers, we learned they were still using our product on new construction because we dominated the specification market, but, due to the price sensitivity in the renovation and retrofit market, we had lost most of our share to less expensive imports.
With this answer, we decided to create a new, lower-cost product under a different brand so as not to cannibalize our specified flagship brand. Not utilizing analytic modeling, we only saw our increasing and upward trend in sales revenue. To summarize, we are flying blind without industry analytics, and with it, we find the commercial truth to take corrective action.
It is simple to perform the market analysis as was done in this case study. You need only three things.
- Sales data for the products that you plan to analyze
- Third-party industry starts data to compare your sales to current and future market conditions
- A tool, like Excel or Access, for more custom analysis beyond what the data vendor or provider includes in a subscription
To begin your company’s quantitative analysis, my recommendation would be an investment in a starts series like ConstructConnect Forecast or from another provider. Starts will provide your enterprise with the most scalable measurement and forecasting options. (Remember, PIP data does not allow for effective cross-disciplinary planning and forecasting exercises such as Raw material procurement headcount/labor/inventory levels.)
In the prior “Product Sales Trend vs. Industry” graph, you can see how, with just some data, you can position your company going forward or track your company on a comparative level with trends and competitors.
Quantitative Analysis for Sales Personnel Assignment and Performance Measurement
In addition to these marketing and operations functions, quantitative analytics can be invaluable to those in sales leadership functions. The quantitative trend analysis is undoubtedly a statement of a macro level sales performance. Still, to improve, it is important to identify the sales strengths and weaknesses.
For example, we see high sales dollars with one sales rep in a region. This result is a good starting point. Is it because of the rep’s personality and sales approaches? Is it because of extra overtime and effort? Or could it be the salesperson is working in a territory with more sales potential than one representative can cover, a shooting fish in a barrel scenario?
You may have a salesperson with a territory that appears to be producing very well. Still, with an analysis, the sales potential in this territory is much more than what an individual salesperson can handle, requiring possibly putting more feet on the street. More salespeople in a high potential region mean more revenue. With so much potential in the designated territory, more salespeople can reach more specifiers and buyers.
Conversely, your most effective salesperson is the one that is outperforming the industry, not necessarily the one with the highest sales dollars. The only way to uncover these commercial truths is through market analysis.
So how can you specifically use data to serve your sales team best and set them up for success? First, we will need third-party analytics, like ConstructConnect Forecast. Below is a graphic in which ConstructConnect Forecast was used to determine the regional potential of construction sales potential.
ConstructConnect Forecast is available down to the U.S. county level, allowing BPMs to aggregate industry analytics to the sales territory and region levels allowing the following:
- Creation and positioning of sales territories and regions
- Sales forecasting and the setting of sales goals
- Measure sales performance at the National, regional, and territory levels
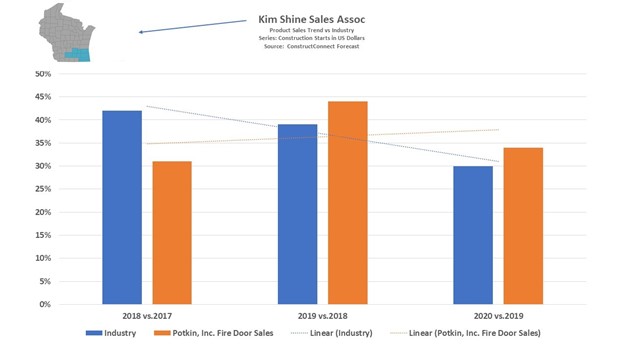
Again, using ConstructConnect Forecast, the examples below illustrate a regional and territory analysis. In the regional example, sales leadership can quickly see that the North Central Region for Potkin Fire Door Company is outperforming the industry. And in the second territory graph, Kim Shine Sales, an independent rep for Potkin Fire Door Company, has done a great job of taking sales beyond the industry sales for the period.
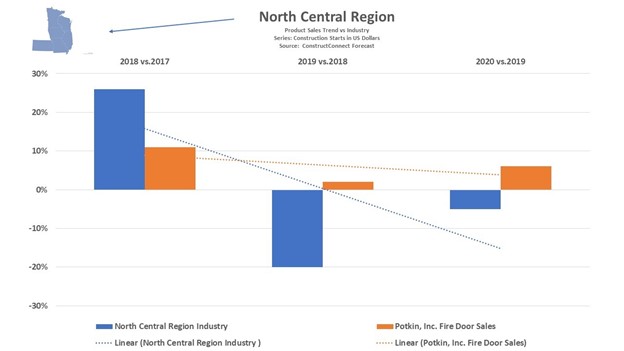
Conversely and perhaps more important, sales leadership can identify soft spots and do what is needed to correct sales against industry shortfall.
Finally, for those BPMs who want to take this sales science to a more granular (and perhaps unnecessary) level, this data can be applied as a building product unit of measurement (or use factor) to create product demand models.
Caution! From my experience as an analyst, product demand models can be pretty resource-intensive to develop and maintain. Granted, they are nice to have, but only after you have the basic analytical models that have been created and put into practice.
The use factor models are not completely necessary to manage a data-driven BPM enterprise. Start with the fundamentals and pin down how you track against the industry at the national, regional, and territory levels. That will be enough for you to uncover the commercial truth and manage your data-driven enterprise.
For those who wish to go more granular, creating a product demand model requires developing an incident rate of a particular product’s usage, generally referred to as a use Factor. Use factor is defined as:
“A derived multiplier, based on historical data, that relates the predictable use or sale of product to a more general measure of construction such as dollar valuation, square footage, dwelling units, ETC, used to estimate how much of a given product will be consumed in any given project, or aggregation of projects.” – Nine Keys to Increasing Profits in New Construction, Richard B. Crisp, Ph.D.
Here’s a use factor example from my door hardware days:
- Exterior fire door = 3 – 4.5 x 4.5 heavyweight ball-bearing hinges per door
- Interior classroom door = 3 – 4.5 x 4.5 ball, or plain bearing hinges per door
Hinges were easy, but you can see the equation example. Even in the case of hinges, the types and quantity vary by project type, meaning schools and healthcare facilities consume higher grade hinges throughout the project versus hotels and office buildings.
If you would like to create use factors, ConstructConnect can suggest tools. Feel free to contact us.
The above quantitative data can easily be used for multiple analytical purposes, providing the BPM with essential insight to grow their business.
Stay tuned for the next segment in this series, where I will address creating a multi-channel strategy with qualitative analytics and how to target the building team to get specified and sold.
 With over 30 years of industry experience, Doug Bevill – Vice President at ConstructConnect, specializes in consulting with building product manufacturers on general strategy and optimal ways to leverage ConstructConnect’s best-in-class construction information and other marketing solutions to run their businesses.
Responses