Information mining as a way to affect the productivity curve in construction.
Success in the AEC industry comes down to productivity. Unfortunately, as we all know from many famous studies, productivity has not changed much in the AEC industry. However, there is a deep well of potential for BIM to help show us how problems in our project delivery workflow can be re-thought. VIATechnik is achieving a finer understanding of our productivity levels by collecting and organizing data output from the software backbone of the project. This has the potential to truly impact the industry as we discover ways to improve communication and move closer to a single shared source of information for all project teams.
Understanding the Whole Workflow
We cannot identify potential areas for improvement without seeing the full picture of daily project interactions. We need to consider the whole workflow, from the VDC team all the way down to the field. On the VDC/BIM side, we are constantly generating information that on-site teams almost never get to see. At the same time, there are a lot of different and important processes going on the construction site that the BIM team will never see. Further, the manual processes for observations and progress monitoring are inherently time-consuming, error prone, and infrequent. They do not capture or analyze enough data, thereby missing opportunities to inform future projects or help with current ones.
If that seems like a lot, it is. Spending weeks working with every stakeholder to develop the perfect workflow is untenable. Not only do the complexities of the construction industry make this a daunting task, there are ongoing projects that can be assisted now. This means we need to extract and analyze data automatically to determine where the project needs additional support and develop solutions that can be rapidly deployed.
Methods for capturing data
There are several techniques for getting information out of your models and into a format that is easily digested. The key is to cast as wide a net as possible to paint a full picture of the daily workflow.
On the BIM team side there is data from AEC tools – Revit, Dynamo, Navisworks, AutoCAD, etc. Along with the model information we are going to parse software log files. These log files have a lot of information that allows you to fully understand the state of your digital assets and behavior of users.
Let’s assume the model is in Autodesk Revit. The diagram below shows a procedure for mining data.
The first and most basic technique for getting information out of the model is to export Revit schedules into a CSV file. This requires excessive manual work and the data will be relatively limited. To remedy this, there are a number of add-ins you can use to pull information into MS Excel spreadsheet and push volumes of precise, consequential BIM data back into your Revit model with speed, ease, and accuracy.
Dynamo exhibits the most flexibility and potential in what types of data can be extracted from the Revit model. It works across multiple platforms and allows us to filter information for export to different data serialization formats like XML, Json, HTML, CSV.
For maximum efficiency, a database should be linked to the project. This allows you to work with large volumes of changes – one of the factors seriously impairing construction productivity. There are a couple of ways to do it, from the simple Revit DB Link to the advanced one with Autodesk Forge. While in the design phase, the database displays item parameters from Revit in a table that you can edit before importing/exporting. This table also allows you to create Revit Shared Parameters which adds new fields for those parameters in the related tables. Any change made to these new fields within the database updates Revit Shared Parameters upon future imports.
Our ability to effectively coordinate geometric and parametric data is tied to the ability of software vendors to add features. This is particularly painful at the interface between design intent and design construction – BIM models are inherently generalist and the lack of common data storage makes it difficult for that data to be useful for fabrication. The database itself could be the part that transitions the information from phase to phase on the project. It requires a little bit of work upfront but it’s a lot less disruptive than manually changing parameters in the model and printing out updated spool sheets for every RFI response.
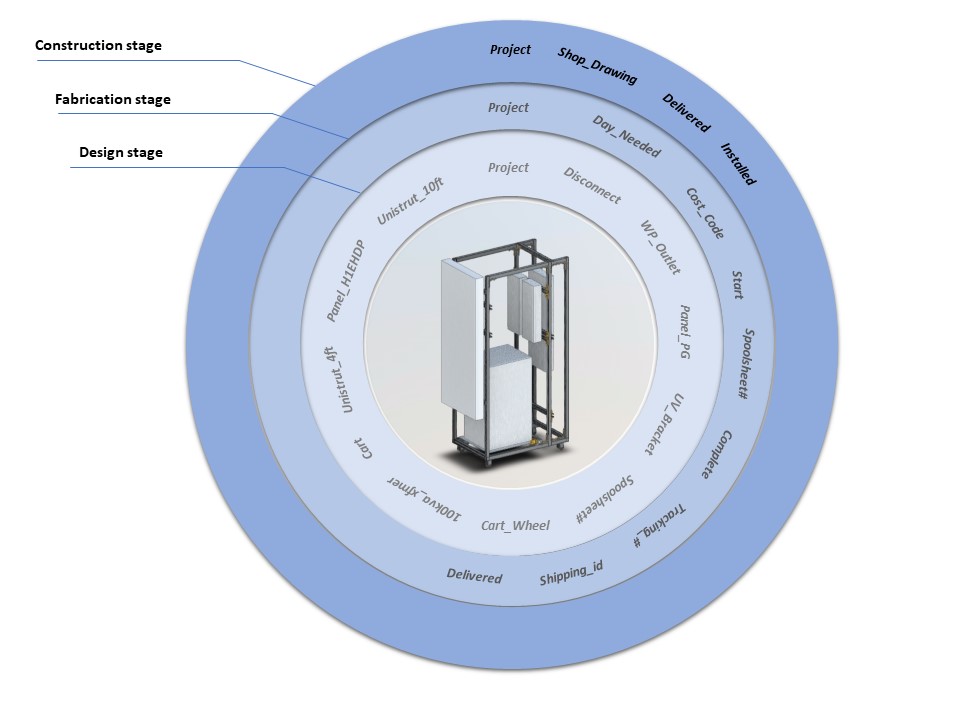
On the fabrication side we improve the relative efficiency of labor by registering spool sheets in the database. This way the spool sheets will never get lost. Next, the most accurate measure of productivity in the fabrication stage is the number of units produced per person-hour consumed. In order to calculate that, we need to capture parameters like assembly build time and cost per assembly item. Additionally, the floor supervisor in the shop is tracking material stack in-house, so it’s easy to use the database we’ve developed to eliminate the material shortages.
We will also measure the productivity of on-site teams. Bluebeam Revu can cut down on administrative tasks by tracking, classifying and organizing PDF markups in the markups list. From here we can export a Markup Summary to create an easy-to-read report on site every single day, which can be backed up in a database. This means no double-handling of information and no chance for data to be entered incorrectly or manipulated wrongly on its way into your database.

Lastly, there is design productivity, notoriously difficult to measure because design is an iterative process. But we can still mine the software for hints. As we’ve mentioned earlier, along with what is in the model we are also going to parse Revit’s log files. The log files are a rich data resource that will allow you to fully understand the state of your digital assets and behavior of users. Using Dynamo and Revit API also allows you to know how many times a certain script has been used so you can track the team’s performance.
Creating Solutions from Collected Data
So now you have a ton of data; what can you do with it? At the end of the day, this is your data, and your story – we are interested in allowing you to come up with your own questions. Based on experience, here are a few scenarios made possible through these methods.
Improving Site Communication
Scenario #1: During projects there will be items that fall outside of the design team’s scope, some of which will be caught in the planning stages but all of which impact the site team. They will address the missed items “on the fly” in the field. How can we improve the way the site team communicates with the design and manufacturing teams in these instances?
Answer #1: Using a database, we can create something like an app-based mobile ordering system that allows the site team to “purchase” an assembly from a pre-fabrication shop. By implementing Google Forms into your workflow you can save data into a Google Sheet, which can be used as a backend database.
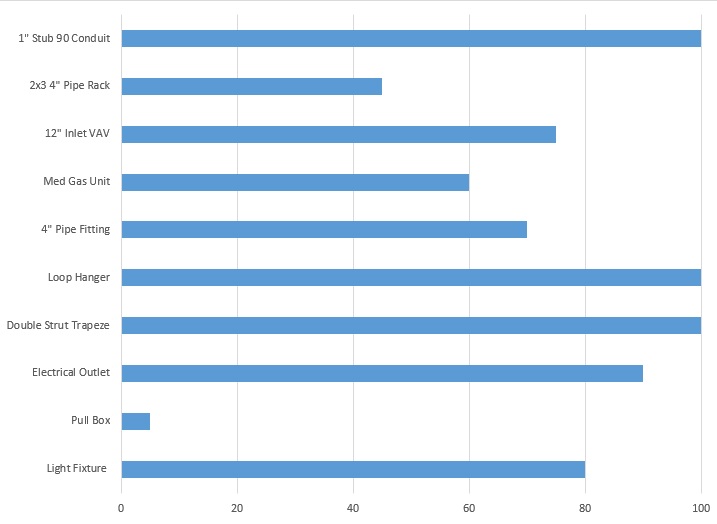
Scenario #2: Let’s say that you shared with users a list of assemblies. How do you know that the assemblies that you built are the ones people actually use instead of just cluttering their experience? What if you could track how much items from these assemblies are being used for the whole company?

Answer #2: With the database we can visualize usage frequency into a chart. Then we can easily see what the easy cut is. Why spend the resources creating, updating, and deploying these to the whole company if no one uses them? Remember a famous quote from Mies van der Rohe: “Less is more”.
Scenario #3: Each Revit user executes specific commands more than any other commands. Take the pattern “pick lines” → “trim/extend two lines or walls to make a corner” → “finish sketch” – according to mined Revit logs, it accounts for 50% of all sequential command input patterns. Can we increase productivity with this information?
Answer #3: Yes! Frequency of input can indicate either high or low productivity – power users input more overall commands while users in need of more assistance will show lower numbers. Users with higher skills can be used to train those less experienced and can also be a source for new ideas about improving the workflow.
Scenario #4: Recently a Notice to Bidders requested experience with cable-stayed bridge construction with a minimum span of 400 feet. Unless we can verify precisely and quickly how much of a particular kind of work we do in our jobs, we cannot provide timely responses to potential partners.
Answer #4: This is perhaps one the most important groupings of information, among the most difficult to gather, but critical for several of our competitions. Based on our own database we will be able to estimate new projects.

Conclusion
The key to working better is a better understanding of how we work. The idea that you need advanced help to collect, automate and visualize AEC data can initially seem like a superfluous expense, especially if the desired solution is complex. But the initial investment will deliver in spades once implemented. Companies can use the system again and again to tweak their workflow and improve efficiency within a project and for the next one. This will only improve the bottom line. It is not simply exporting data into Excel files; it is creating a knowledge base for understanding and visualizing our workflow from command line input to site installation and every step in between.
About the Author
Slava Krel is a Senior VDC Engineer at VIATechnik in Phoenix. Specializing in MEPF BIM coordination and Scan-To-BIM workflows he leverages his understanding of data flow, from concept through construction. Slava is passionate about programming for the construction industry. He is using consolidated practical experience and software development skills in solving specific problems of automation across operations including modeling, coordination, document control, logistics, project controls, as-built logging, construction site management, and construction administration.


Responses