Engineering Megaprojects Take Center Stage
ConstructConnect announced today that January 2022’s volume of construction starts, excluding residential work, was $29.2 billion. The latest month’s nonresidential dollar volume was -4.5% versus the same month of the previous year, January 2021. On the positive side, though, January 2022 was +11.5% compared with its preceding month, December 2021.
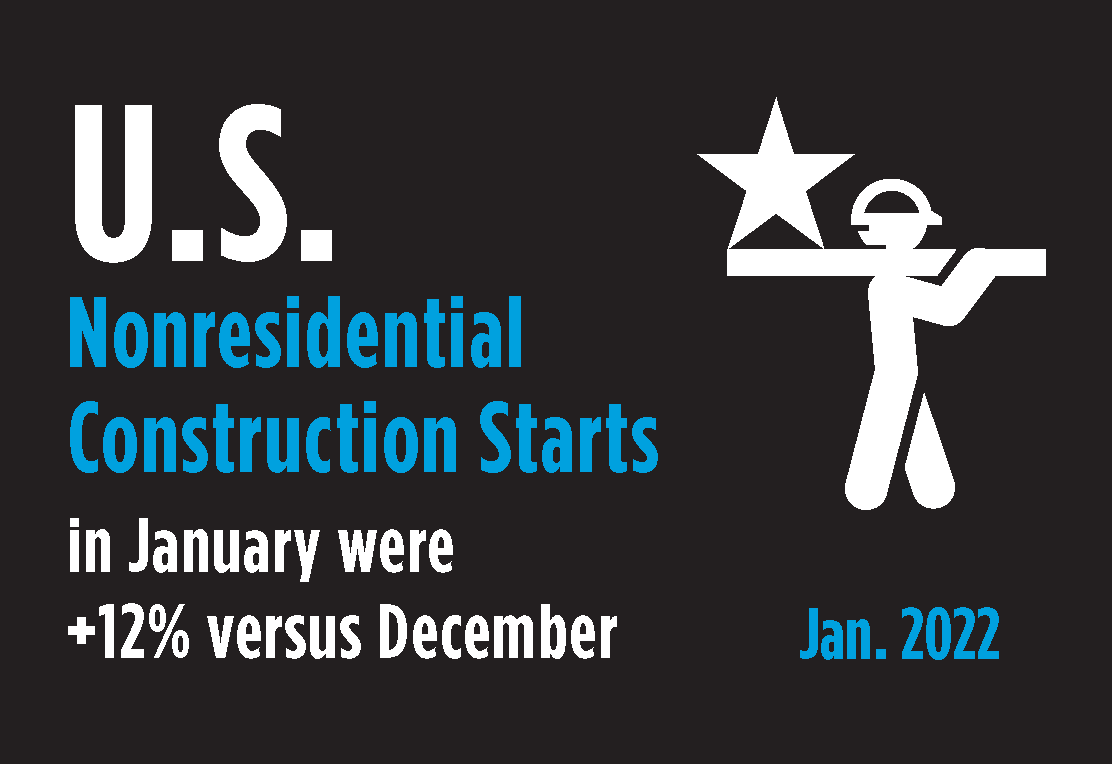
The +11.5% m/m runs counter to seasonality (i.e., colder winter weather) which usually acts to restrain groundbreakings. One mega-sized engineering project made the difference, the South Fork wind farm (to generate electric power) in Suffolk County, New York, for $2 billion.


View this information as an infographic.
Click here to download the complete Construction Industry Snapshot Package – January 2022 PDF.
Interestingly, January of 2021 also included a mega-sized power project, but a transmission line in Maine for $1.0 billion. In the first month of last year, there was also a startup on another engineering project, Enbridge’s Line 3 pipeline work for $2.6 billion.
If those three notably impressive megaprojects are netted out of the January 2022 and January 2021 starts results, then the non-mega starts volumes become almost even ($27.2 billion this year vs $27.0 billion last year), rather than -4.5%.
GRAND TOTAL starts in January 2022 (i.e., including residential activity) were -2.3% y/y, but +5.8% m/m.
Regular readers of this Industry Snapshot will know there’s usually commentary on year-to-date results. It may be stating the obvious, but it’s worth flagging nonetheless that January (i.e., the first month of the year) and year-to-date results are one and the same. Year to date only takes on meaning from February on.
A Shaky Beginning for Nonresidential Building Starts
There are three major subcategories of total starts: residential, nonresidential building, and heavy engineering/civil. On a year-over-year basis in January 2022, engineering starts were strongest at +2.0%; residential starts were minimally ahead, +0.4%; and nonresidential building starts were wobbly at -9.9%.
On a month-to-month basis in January 2022, the engineering starts subcategory cast a bright light, +63.7%; residential flickered with little moderation, -0.6%; and the switch controlling nonresidential building was dimmed, -14.7%.
Progressive Steady Gains in Y/Y Trailing 12-Month Starts
Other statistics often beloved by analysts are trailing twelve-month (TTM) results and these are set out for all the various type-of-structure categories in Table 10.
Grand Total TTM starts in January 2022 on a month-to-month basis were -0.2%, which was a mild deterioration from the no change (0.0%) performances that occurred in December 2021 and November 2021.
On a year-over-year basis in January 2022, GT TTM starts were +7.3%, an improvement over December 2021’s figure of +6.7%. In turn, the +6.7% was a step up from November 2021’s +4.8%. The progressive steady gains in y/y results from one month to the next suggest a contracting marketplace that is responding to a generally warmer economic climate, with a downscaling of the pandemic (keeping all fingers and toes crossed) more clearly on the horizon.
Profound (Temporary?) Shift in PIP Residential Vs. Nonresidental Stats
‘Starts’ compile the total estimated dollar value and square footage of all projects on which ground is broken in any given month. They lead, by nine months to as much as two years, put-in-place (PIP) statistics which are analogous to work-in-progress payments as the building of structures proceeds to completion.
PIP numbers cover the ‘universe’ of construction, new plus all manner of renovation activity, with residential traditionally making up two-fifths (about 40%) of the total and nonresidential, three-fifths (i.e., the bigger portion, at around 60%). Over the past year, though, the mix has undergone a profound shift. In 2021’s full-year PIP results, the residential to nonresidential relationship was approximately half and half, with the former being 49.3% of total and the latter, 50.7%. In December on its own, on a not seasonally adjusted (NSA) basis, it was residential 48.3% and nonresidential, 51.7%. (Nonresidential is nonresidential buildings plus engineering).
For full-year 2021 versus full-year 2020, the total dollar volume of PIP construction was +8.2% y/y, with residential being +22.9% and nonresidential, -3.1%. In 2022, the expectation is that the relative boom in residential activity will gradually be superseded by an upswell of nonresidential activity.
PIP numbers, being more spread out, have smaller peak-over-trough percent-change amplitudes than the ‘starts’ series. As an additional valuable service for clients and powered by its extensive ‘starts’ database, ConstructConnect, in partnership with Oxford Economics, a world-leader in econometric modeling, has developed put-in-place construction statistics by types of structure for U.S. states, cities, and counties, ‘actuals’ and forecasts. ConstructConnect’s PIP numbers are being released quarterly and are featured in a separate reporting system.
Growth Rate in Construction Jobs Slower Than in ‘All Jobs’
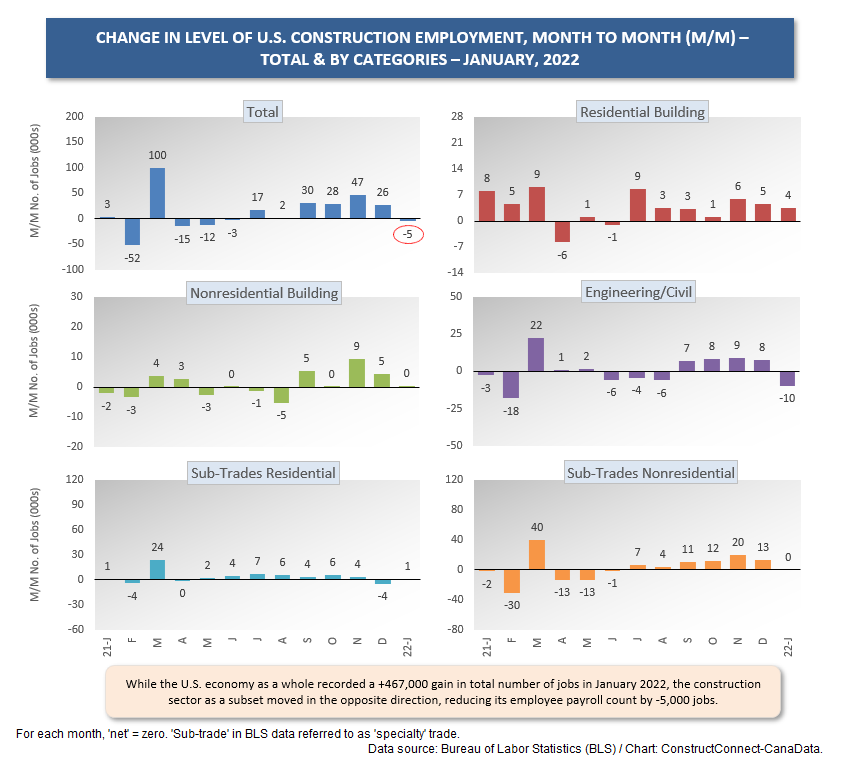
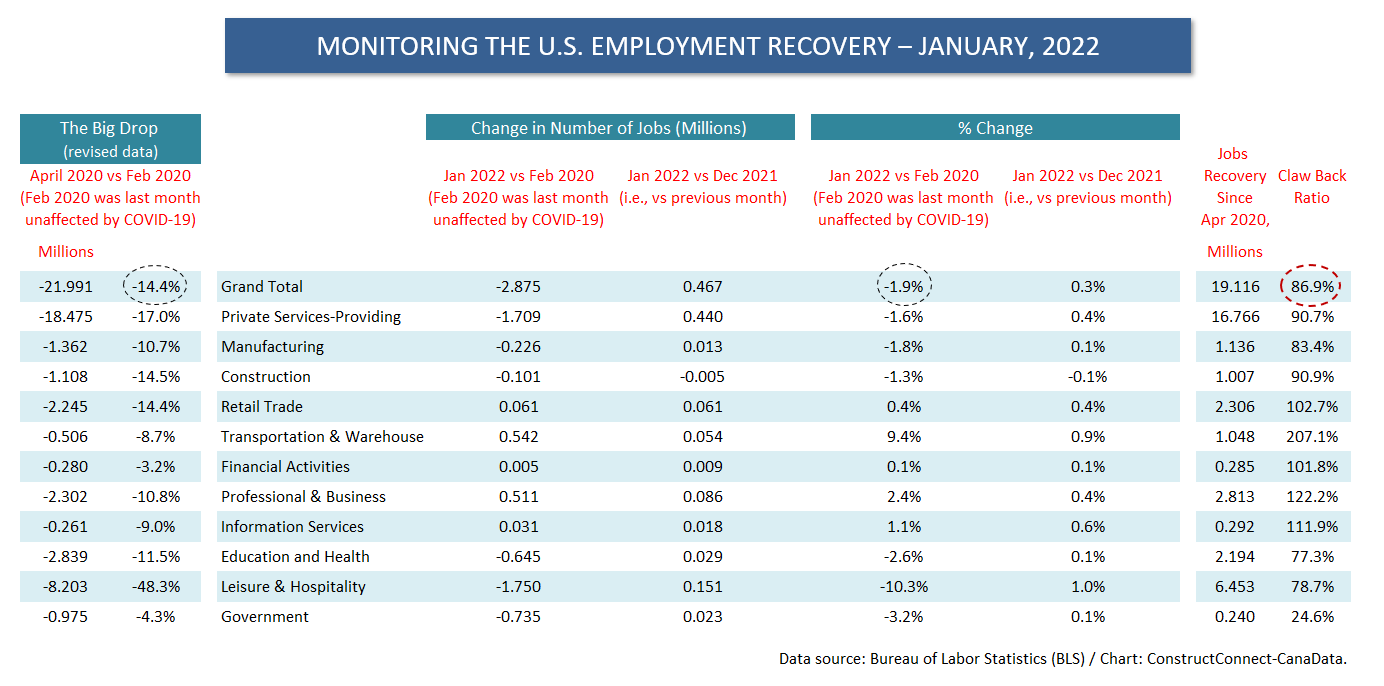
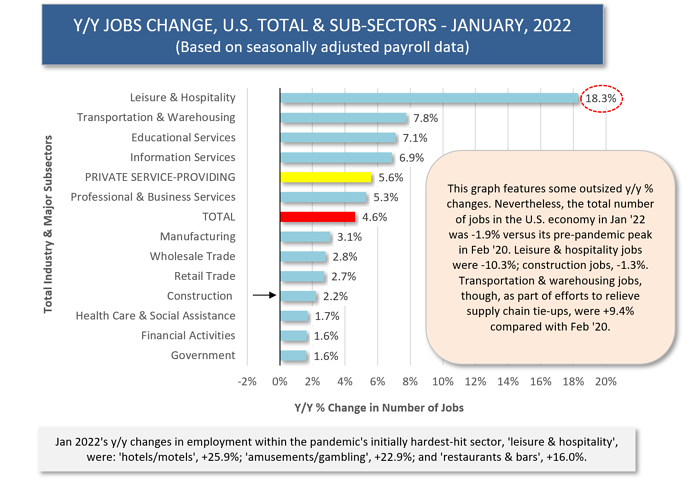
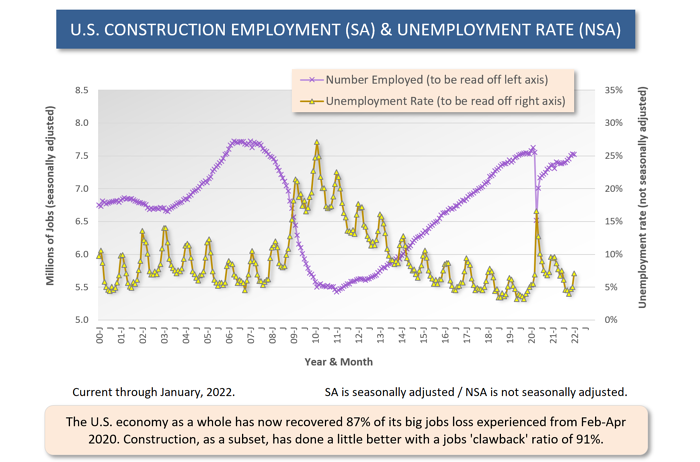
The U.S. economy’s average month-to-month increase in its total jobs count since January 2021 (13 months ago) has been truly impressive at more than half a million (+549,000). The construction sector, as a subset of ‘total,’ has not shared in this bounty. Construction’s month-to-month average employment gain over the same period has been only +13,000 jobs.
In January, as total employment in the whole economy swelled by +467,000 jobs, construction saw a contraction of -5,000 jobs. The not seasonally adjusted (SA) unemployment rate for ‘all jobs’ in the latest month was 4.4%. That’s only about a percentage point above the lowest figure to which the NSA unemployment rate is ever likely to descend. Construction’s NSA unemployment rate in January 2022 was 7.1%, up from 5.0% in December, but an improvement vs January 2021’s 9.4%. Prior to the pandemic, in both May and September 2019, the U.S. construction sector managed a pleasingly low NSA U rate of just 3.2%.
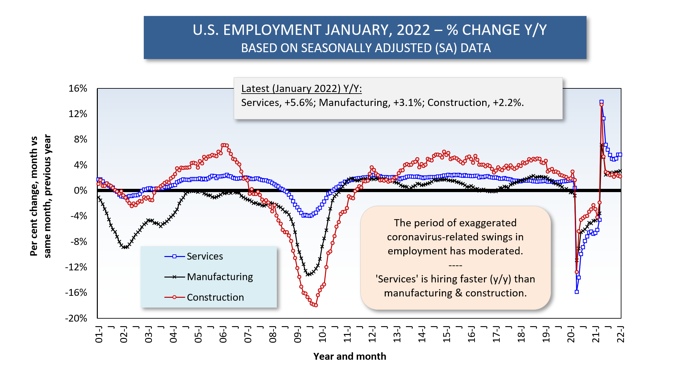
The total U.S. jobs count was +4.6% y/y in January 2022. Construction’s y/y jobs climb was less than half as fast, +2.2%. The most recent y/y jobs gains in other corners of the economy with close ties to the building sector have been: +8.3% for machinery and equipment rental; +6.0% for architectural and engineering services; +4.2% for both real estate firms and oil and gas extraction; +1.1% for cement and concrete product manufacturing; and -5.0% for building material and supplies dealers.
As an interesting aside, the ‘building material and supplies dealers’ designation is one aspect of bricks and mortar retail that has not experienced mass abandonment in favor of purchases made over the Internet. One reason has been the key logistics role played by such outlets in supplying the needs of local contractors and do-it-yourselfers.
Pluses and Minuses Among the Type of Structure Subcategories
January 2022’s +11.5% month-to-month (m/m) jump in total nonresidential starts owed its vitality to strength in industrial (+183.7%) and heavy engineering/civil (+63.7%) starts. Institutional (-12.8%) and commercial (-35.3%) were of a different mind.
The -4.5% performance of total nonresidential starts in January of this year versus January of last year (y/y) resulted from declines of nearly equal magnitude in institutional (-13.0%) and commercial (-12.2%) that were not offset by the pickups in industrial (+5.3%) and heavy engineering/civil (+2.0%).
There are two dominant subcategories of total nonresidential starts. When the volumes of ‘roads/highways’ and ‘schools/colleges’ are added together, they accounted for more than one-third of total nonresidential activity in January 2022 (i.e., shares of 18.8% and 16.7% respectively, summing to 35.4%).
There are two dominant subcategories of total nonresidential starts. When the annual volumes of ‘roads/highways’ and ‘schools/colleges’ are added together, they accounted for nearly one-third of total nonresidential activity in 2021 (i.e., shares of 16.8% and 14.6%, summing to 31.4%).
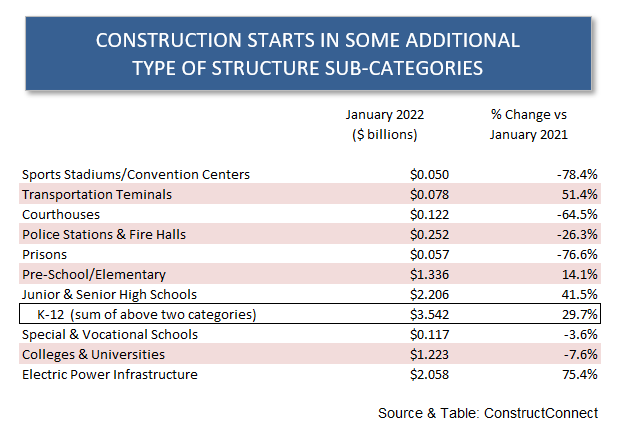
The two percentage-change metrics for street starts in January 2022 were +56.5% m/m and +52.8% y/y. For school starts, the results may not have been as bullish, but they were still upbeat, +36.4% m/m and +16.9% y/y. On a y/y basis, K-12 school starts in January were +29.7%, whereas college and university groundbreakings languished, at -7.6%.
Accounting for a fifth of engineering starts, the ‘water/sewage’ subcategory in January was +27.3% m/m, but -2.5% y/y. Everyone is waiting for the first wave of Infrastructure and Investment Jobs Act (IIJA) money to appear on the scene.
Miscellaneous civil starts in January of this year were +298.4% m/m, but -42.7% y/y. The $2 billion electric power wind farm project this year helped with the m/m comparison. In the y/y standoff, however, this year’s mega project was overwhelmed by the $3.6 billion in power transmission line plus pipeline work launched in January of last year.
For the three medical subcategories combined, i.e., ‘hospital/clinic,’ ‘nursing/assisted living,’ and ‘miscellaneous medical,’ January 2022’s starts were -26.0% m/m and -35.8% y/y. ‘Hospital/clinic’ starts alone were -39.9% m/m and -44.3% y/y. One month doesn’t necessarily speak volumes concerning the full year to come. Nevertheless, January wasn’t an auspicious beginning to 2022 for new health care construction activity.
Among commercial starts in January, the ‘hotel/motel’ and ‘retail/shopping’ subcategories stood out for their positivity. The former was +72.4% m/m and +35.3% y/y; the latter, +130.0% m/m and +9.3% y/y.
The dollar volume of private office building starts in the latest month was +24.3% m/m, but -21.0% y/y. Warehouse starts were similarly ahead m/m, +12.5%, but behind y/y, -28.6% y/y.
JOLTS a Clear Source of Frustration for Contractors
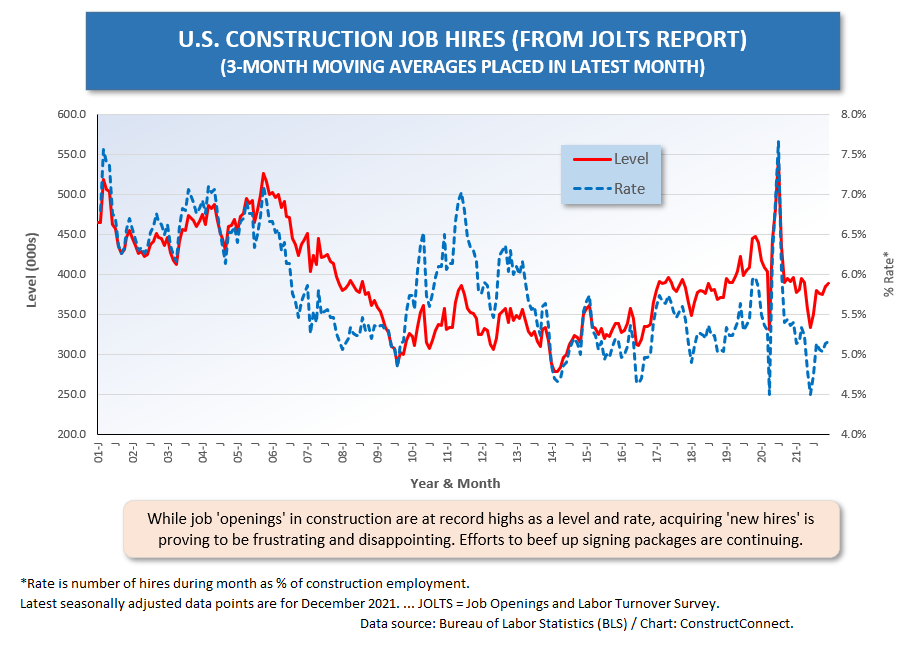
For ease of viewing, Graphs 5 and 6 show ‘smoothed’ curves (i.e., based on three-month moving averages) for the Job Openings and Labor Turnover Survey (JOLTS) results pertaining to vacant positions and hires.
Simply eyeballing the two graphs reveals a great source of frustration for contractors. Job openings in the sector, whether measured as a level or a rate, are currently as high as they have ever been. But there has been limited success in enticing potential workers to come on board in the sector. ‘Hires,’ as a level and a rate, aren’t far above their all-time floors.
Graph 5: U.S. Construction Job Openings (from JOLTS Report)
(3-month Moving Averages placed in Latest Month)

Trend Graphs Stuck on Middle Ground
The Nonresidential Construction Starts Trend Graphs – January 2022 offer up a dozen type-of-structure trend graphs. The trends are captured by taking 12-month moving averages of ConstructConnect’s starts statistics.
The slopes in most of the graphs have moved onto even plains. The steep drops of the early pandemic days are largely in the past. Sharp climbs, however, are not yet being realized.
Most noticeable concerning the latest month or two, are the ongoing descent for ‘miscellaneous civil;’ the leveling off for ‘schools/colleges;’ and the upward momentum being maintained for ‘roads/highways.’ ‘Private office buildings’ in January 2022 moved sideways.
Wage Hikes Spike to +6.9% Y/Y
Tables B-3 and B-8 of the monthly Employment Situation report, from the BLS, record average hourly and average weekly wages for industry sectors. B-3 is for all employees (i.e., including bosses) on nonfarm payrolls. B-8 is for ‘production and nonsupervisory personnel’ only (i.e., it excludes bosses). For ‘all jobs’ and construction, there are eight relevant percentage changes to consider.
From January 2022’s Table B-3 (including bosses), ‘all jobs’ earnings were +5.7% hourly and +4.2% weekly. Construction workers, encompassed within ‘all jobs,’ weren’t quite as richly rewarded, at +5.1% hourly and +3.8% weekly. But it was in January’s Table B-8 for production and nonsupervisory workers (i.e., excluding bosses) where the truly shocking compensation advances were revealed, +6.9% hourly and +5.4% weekly for ‘all jobs’. Construction workers as a subset of ‘all jobs’ in the latest month earned +5.8% y/y hourly and +4.8% y/y weekly.


Bid Price Increase Chasing Input Cost Increases
January’s y/y results for three building-related BLS Producer Price Index (PPI) series were as follows: (A) ‘construction materials special index,’ +34.1% (little changed from December’s +34.9%); (B) ‘inputs to new construction index, excluding capital investment, labor, and imports,’ +18.7% (again, only a slight downshift from the previous month’s +18.8%); and (C) ‘final demand construction,’ designed to capture bid prices, +16.1% (a sharp rise from December’s +12.3%).
(A) comes from a data series with a long history, but it’s confined to a limited number of major construction materials. (B) has a shorter history, but it’s more comprehensive in its coverage, although it includes some items (e.g., transportation) that aren’t strictly materials.
Concerning the cost of some major construction material inputs, as revealed in the PPI data set published by the BLS, hot rolled steel bars, plates, and structural shapes in the latest month were +59.2% y/y; asphalt, +46.7%; aluminum sheet and strip, +34.6%; gypsum, +23.0%; softwood lumber, +20.1%; copper wire and cable, +17.5%; ready-mix concrete, +9.1%; and cement, +8.9%.
The value of construction starts each month is derived from ConstructConnect’s database of all active construction projects in the U.S. Missing project values are estimated with the help of RSMeans’ building cost models. ConstructConnect’s nonresidential construction starts series, because it is comprised of total-value estimates for individual projects, some of which are super-large, has a history of being more volatile than many other leading indicators for the economy.
January 2022’s ‘Grand Total’ Starts -2.3% Y/Y; +5.8% M/M
From Table 10 on page 11 of this report, ConstructConnect’s total residential starts in January 2022 were -0.6% m/m, but +0.4% y/y. Multi-family starts in January were +23.5% m/m and +8.2% y/y. Single-family starts were -7.3% m/m and -2.2% y/y.
Including home building with all nonresidential categories, Grand Total starts in January 2022 were +5.8% m/m, although -2.3% y/y.
ConstructConnect adopts a research-assigned ‘start’ date. In concept, a ‘start’ is equivalent to ground being broken for a project to proceed. If work is abandoned or rebid, the ‘start’ date is revised to reflect the new information.
Expansion Index Monitors Construction Prospects
The economy may be in recovery mode, but nonresidential work is usually a lagging player. Companies are hesitant to undertake capital spending until their personnel needs are rapidly expanding and their office square footage or plant footprints are straining capacity. Also, it helps if profits are abundant. (Today’s greater tendency to work from home has made office occupancy much more difficult to assess.)
Each month, ConstructConnect publishes information on upcoming construction projects at its Expansion Index.
The Expansion Index, for hundreds of cities in the United States and Canada, calculates the ratio, based on dollar volume, of projects in the planning stage, at present, divided by the comparable figure a year ago. The ratio moves above 1.0 when there is currently a larger dollar volume of construction ‘prospects’ than there was last year at the same time. The ratio sinks below 1.0 when the opposite is the case. The results are set out in interactive maps for both countries.
Click here to download the Construction Industry Snapshot Package – January 2022 PDF.
Click here for the Top 10 Project Starts in the U.S. – January 2022.
Click here for the Nonresidential Construction Starts Trend Graphs – January 2022.
TABLE 6: VALUE OF UNITED STATES NONRESIDENTIAL CONSTRUCTION STARTS
JANUARY 2022 – CONSTRUCTCONNECT

*Includes transportation terminals and sports arenas.
Source: ConstructConnect Research Group and ConstructConnect.
Table: ConstructConnect.
TABLE 7: VALUE OF UNITED STATES CONSTRUCTION STARTS
CONSTRUCTCONNECT INSIGHT VERSION –JANUARY 2022
Arranged to match the alphabetical category drop-down menus in INSIGHT

Table 2 conforms to the type-of-structure ordering adopted by many firms and organizations in the industry. Specifically, it breaks nonresidential building into ICI work (i.e., industrial, commercial, and institutional), since each has its own set of economic and demographic drivers. Table 3 presents an alternative, perhaps more user-friendly and intuitive type-of-structure ordering that matches how the data appears in ConstructConnect Insight.
Source: ConstructConnect.
Table: ConstructConnect.
TABLE 8: VALUE OF UNITED STATES NATIONAL CONSTRUCTION STARTS – JANUARY 2022 – CONSTRUCTCONNECT
Billions of current $s, not seasonally adjusted (NSA)

Data Source and Table: ConstructConnect.
TABLE 9: U.S. YEAR-TO-DATE REGIONAL STARTS,
NONRESIDENTIAL CONSTRUCTION* — CONSTRUCTCONNECT

*Figures above are comprised of nonres building and engineering (i.e., residential is omitted).
Data Source and Table: ConstructConnect.


Responses