High-Tech Giants Step to the Plate
ConstructConnect announced today that August 2021’s volume of construction starts, excluding residential work, was $33.0 billion (see shaded green box, bottom of Table 8 below) a decrease of -14.2% vs July 2021’s level of $38.5 billion (originally reported as $37.6 billion).
Compared with August 2020, the latest month’s nonresidential starts were -11.1%. On a year-to-date basis, they were -6.4%. GRAND TOTAL starts in August 2021 (i.e., including residential activity) were -2.3% m/m, +4.5% y/y and +6.0% ytd.
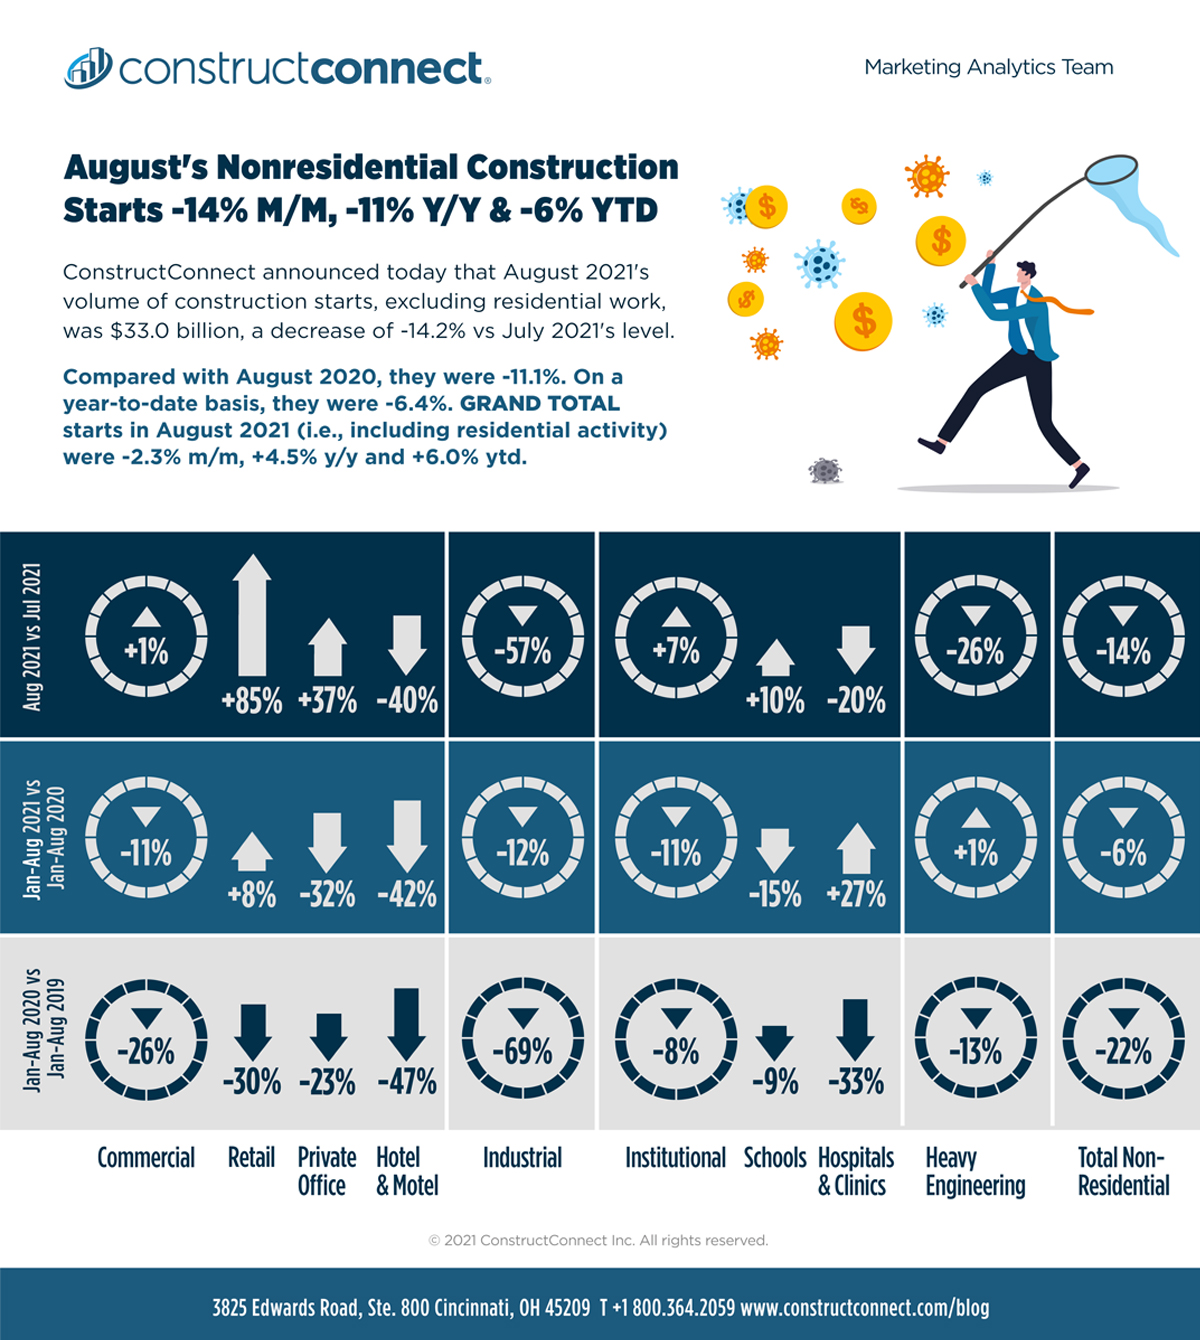
View this information as an infographic.
Click here to download the complete Construction Industry Snapshot Package – August 2021 PDF.
Several of the biggest construction project initiations in the latest month were carried out by the high-tech giants. The ‘Top 10’ projects list (see Top 10 Project Starts in the U.S. – August 2021) of this report records go-aheads for two Facebook data centers, one in Mesa, Arizona and the other in Prineville, Oregon, plus a Google data center in Kansas City, Missouri. Among the next ten biggest project starts in August—in other words, projects that would have appeared if the list had been expanded to become a Top 20 list—were three Amazon fulfillment centers, in Pataskala, Ohio; Sioux Falls, South Dakota; and Rochester, New York. Each of the Amazon projects is projected to exceed a million square feet.
During the pandemic, low-rise light industrial and commercial building construction has flourished. Elaborating further there’s been strong owner support for data and distribution centers. Demand for new shopping malls, however, has been skimpy.
The standout project started in August of last year was the $2.3 billion motor vehicle battery plant in Warren, Ohio green-lighted by General Motors Corporation.
Three Divergent Construction Paths
Starts year to date in 2021, according to the three major type-of-structure categories, have diverged markedly. Residential starts have been ahead by a quarter, +24.6%; heavy engineering/civil starts have been flat, +0.8%; and nonresidential building starts have had trouble finding the light, -10.9%.
On a month-to-month basis in August, residential starts continued to forge ahead, +12.9%; engineering retreated significantly, -25.9%; and nonresidential building pulled back only a little, -3.5%.
Trailing 12-Month (TTM) Results on the Mend
Other statistics often beloved by analysts are trailing twelve-month (TTM) results and these are set out for all the various type-of-structure categories in Table 10 on page 11 of this report. Grand Total TTM starts in August on a month-to-month basis were +0.4%, compared with +1.0% in July and +0.8% in June. On a year-over-year basis in August, GT TTM starts were -1.7% versus -4.5% in July and -7.1% in June. These latest three y/y percent changes may still be negative, but the trend is moving in a healthier (less distressed) direction.
Even Split for Residential and Nonres in the PIP Stats
‘Starts’ compile the total estimated dollar value and square footage of all projects on which ground is broken in any given month. They lead, by nine months to as much as two years, put-in-place (PIP) statistics which are analogous to work-in-progress payments as the building of structures proceeds to completion.
PIP numbers cover the ‘universe’ of construction, new plus all manner of renovation activity, with residential traditionally making up two-fifths (about 40%) of the total and nonresidential, three-fifths (i.e., the bigger portion, at around 60%). Presently, though, according to the Census Bureau’s July 2021 not-seasonally-adjusted (NSA) PIP numbers for the total United States, the year-to-date mix has shifted dramatically. The residential to nonresidential relationship has become approximately half and half (i.e., 49.3%-to-50.7% respectively). The Census Bureau’s July 2021 NSA ytd PIP results are +6.2% for total; +25.3%, residential; and -7.5%, nonresidential (i.e., nonresidential buildings plus engineering).
PIP numbers, being more spread out, usually have smaller peak-over-trough percent-change amplitudes than the ‘starts’ series. As an additional valuable service for clients and powered by its extensive ‘starts’ database, ConstructConnect, in partnership with Oxford Economics, a world-leader in econometric modeling, has developed put-in-place construction statistics by types of structure for U.S. states, cities, and counties, ‘actuals’ and forecasts. ConstructConnect’s PIP numbers are being released quarterly and are featured in a separate reporting system.
Site Work Jobs Count has become Mired Down
Total employment by U.S. general and trade contractors was scaled back by -3,000 jobs in August. (The nominal change in U.S. total employment in August was +235,000.) The construction sector has added only +16,000 jobs in the current year, and that’s been thanks to March’s strong uptick of +93,000 jobs. Leave out March and the year-to-date sitework jobs figure deteriorates to -77,000. Nevertheless, the not seasonally adjusted (NSA) unemployment rate in construction in the latest month tightened to 4.6% from 6.1% in July. In August 2020, it had been 7.6%. (The U.S. ‘all jobs’ NSA unemployment rate is currently 5.2%.)
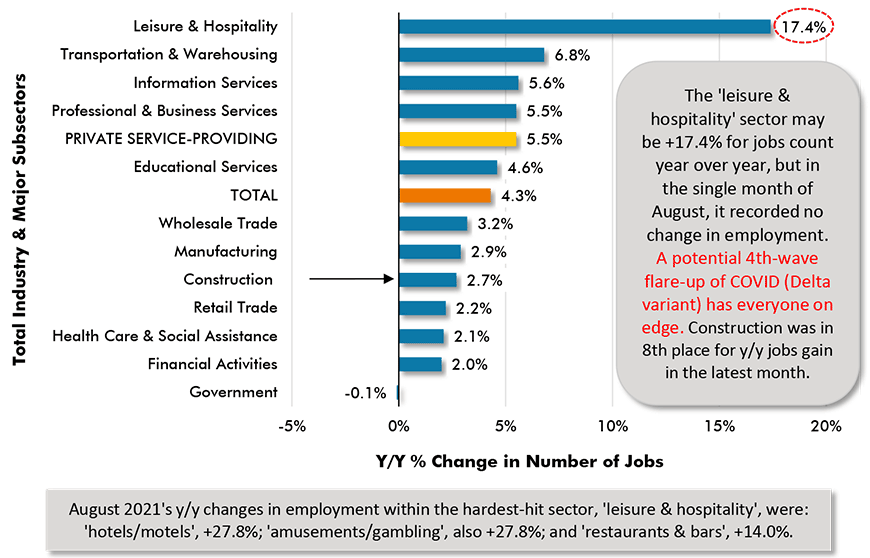
Construction currently ranks a lowly eighth among a dozen major industrial sectors for year-over-year jobs gain. Construction’s +2.7% places it just ahead of retail, at +2.2%, and a tad behind manufacturing, +2.9%. The leisure and hospitality sector has undertaken the greatest hiring spurt, +17.4% y/y. Other corners of the economy with close ties to construction have managed the following y/y increases in employment: architectural and engineering services, +5.3%; real estate firms, +5.0%; machinery and equipment rental and leasing, +4.8%; mining and logging, +3.1%; building material and supplies dealers, -0.8%; and cement and concrete product manufacturing, -2.3%. The +5.3% figure for project design firms augurs well for more construction crews being required in the field once authorizations to proceed are granted.
Graph 1: Change in Level of U.S. Construction Employment, Month to Month (M/M) −
Total & by Categories – August 2021

For each month, ‘net’ = zero. ‘Sub-trade’ in BLS data referred to as ‘specialty’ trade.
Data source: Bureau of Labor Statistics (BLS).
Chart: ConstructConnect.
Graph 2: U.S. Employment August 2021 – % Change Y/Y
Based on Seasonally Adjusted (SA) Data

The latest data points are for August 2021.
Data source: Payroll Survey, Bureau of Labor Statistics (BLS).
Chart: ConstructConnect.
Graph 3: Y/Y Jobs Change, U.S. Total Industry & Major Subsectors − August 2021 (based on seasonally adjusted payroll data)
Data source: Payroll Survey, U.S. Bureau of Labor Statistics (Dept of Labor).
Chart: ConstructConnect.
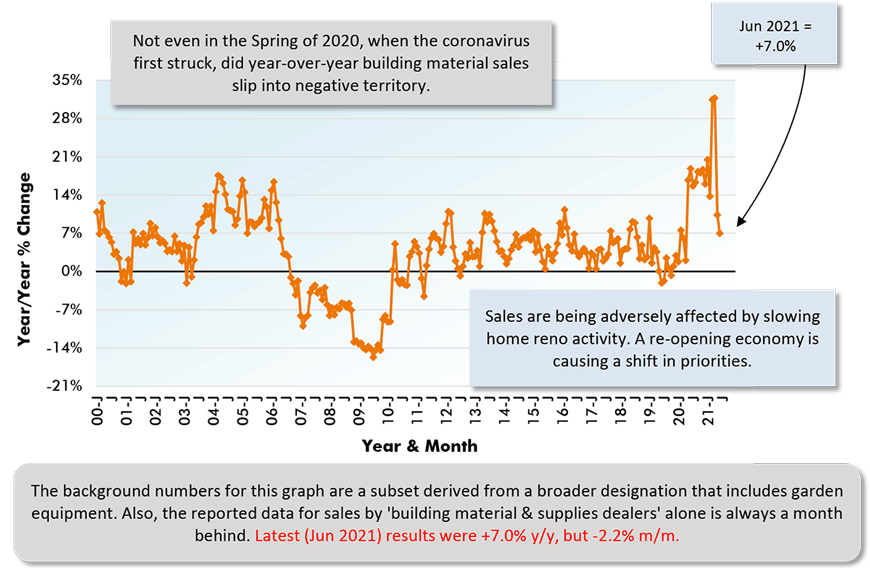
Graph 4: Sales by U.S Building Material & Supplies Dealers
Data source: Census Bureau.
Chart: ConstructConnect.
Table 1: Monitoring the U.S. employment recovery ‒ August 2021

Data source: Bureau of Labor Statistics (BLS).
Chart: ConstructConnect.
Pluses and Minuses among the Type of Structure Subcategories
August’s -14.2% month-to-month (m/m) decline in total nonresidential starts resulted from drops of -57.4% in industrial and -25.9% in engineering. Commercial stayed about even, +0.9%, while institutional notched a slight win, +6.7%.
The -11.1% step back in August 2021’s total nonresidential starts versus August 2020 (y/y) was due to industrial taking a big tumble, -74.5%, and institutional and commercial also faltering, -12.5% and -10.1% respectively. Engineering made a modest gain, +7.3%.
The slide in total nonresidential starts year to date (Jan-Aug 2021/Jan-Aug 2020) of -6.4% owes its negative result to pullbacks of almost equal magnitude in industrial (-11.5%), commercial (-11.3%), and institutional (-11.2%), with engineering being slightly better than even (+0.8%).
There are two subcategories, that when added together, account for a smidge more than one-third of total nonresidential starts year to date, educational with a share of 16.3% and roads/highways with a share of 18.2%. The important time frame metrics for school starts in August were +10.4% m/m; but -1.3% y/y; and -15.1% ytd. Street starts were off by -26.5% m/m, but they were +14.3% y/y and +6.6% ytd.
The category with the third-largest share of total nonresidential starts ytd is ‘water/sewage’. It also suffered a setback m/m in August (-11.2%), but it showed well y/y (+16.1%) and ytd (+11.2%).
Medical facility starts, combining the three subcategories of hospitals/clinics, nursing/assisted living, and miscellaneous medical provided a 7.2% share of total nonresidential starts ytd in August. Groundbreakings in the combined health care category in the latest month were +9.0% m/m, -29.8% y/y and +0.4% ytd. Hospital/clinic starts on their own in August were +27.4% ytd.
Among other sub-categories of starts, good year-to-date performances have been turned in by retail/shopping (+8.1%), amusement (+12.8%), government offices (+24.3%), and miscellaneous commercial (+11.1%—see Coachella Valley arena in the Top 10 projects list). Poor year-to-date performances have been registered by hotels/motels (-42.3%), private offices (-32.3%), religious (-37.5%), bridges (-23.5%) and dam/marine work (-18.7%).
Table 2: Construction Starts in Some Additional Type of Structure Sub-Categories
| Jan-AUG 2021 | % Change vs | |
| ($ billions) | Jan-AUG 2020 | |
| Sports Stadiums/Convention Centers | $3.016 | -19.3% |
| Transportation Teminals | $2.925 | 81.5% |
| Courthouses | $1.688 | 42.0% |
| Police Stations & Fire Halls | $1.933 | -10.2% |
| Prisons | $1.483 | -12.6% |
| Pre-School/Elementary | $12.506 | -21.4% |
| Junior & Senior High Schools | $19.936 | -10.3% |
| K-12 (sum of above two categories) | $32.442 | -14.9% |
| Special & Vocational Schools | $1.201 | -18.3% |
| Colleges & Universities | $10.034 | -15.4% |
| Electric Power Infrastructure | $7.335 | 144.4% |
Data Source and Table: ConstructConnect.
JOLTS Numbers Boost Inflationary Expectations
The monthly JOLTS statistics are exposing a glaring discrepancy. Job ‘openings’ in the construction sector, both as a level and a rate, are presently quite elevated, although they eased off in the latest month for which data is available, July. But ‘hires’, as a level and even more so as a rate, have descended markedly over most of the past little while, although they managed small upward jogs in July.
The problem of finding willing and qualified workers is cropping up in many sectors throughout the economy. Among the best tried and true answers to a labor shortage has always been to offer better wages. This adds one more underlying concern when assessing inflationary expectations.
Graph 5: U.S. Construction Job Openings (from JOLTS Report)
(3-month Moving Averages placed in Latest Month)
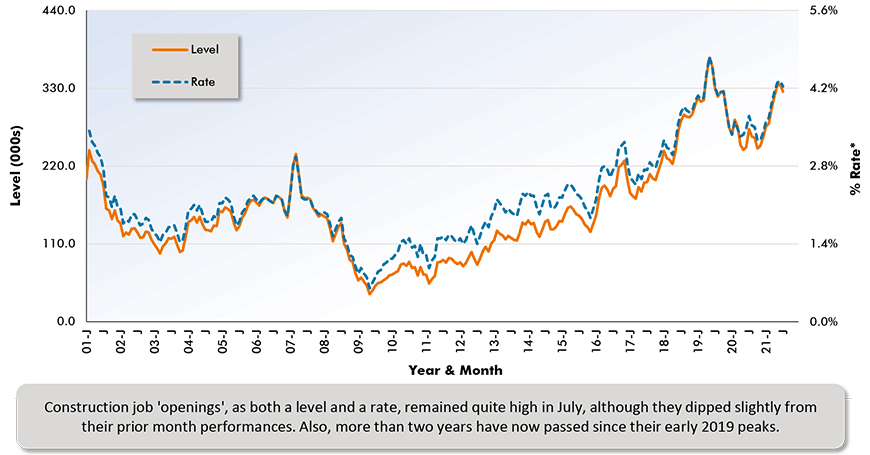
*Rate is number of job openings end-of-month as % of ‘construction employment plus number of job openings’.
Latest seasonally adjusted data points are for July 2021. … JOLTS = Job Openings and Labor Turnover Survey.
Data source: Bureau of Labor Statistics (BLS).
Chart: ConstructConnect.
Graph 6: U.S. Construction Job Hires (from JOLTS Report)
(3-month Moving Averages placed in Latest Month)
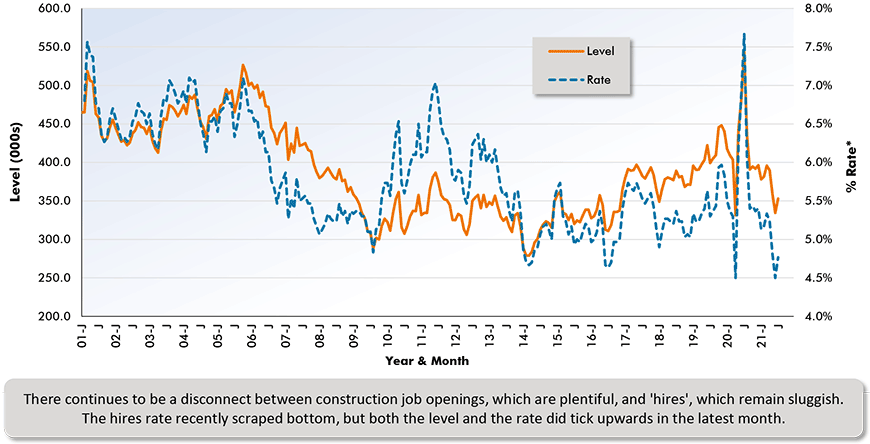
*Rate is number of job openings end-of-month as % of ‘construction employment plus number of job openings’.
Latest seasonally adjusted data points are for July 2021. … JOLTS = Job Openings and Labor Turnover Survey.
Data source: Bureau of Labor Statistics (BLS).
Chart: ConstructConnect.
A Wealth of Interesting Stories in Starts Trend Lines
The 12-month moving average trend graphs (Nonresidential Construction Starts Trend Graphs – August 2021) are telling interesting stories.
The descent in the nonresidential curve appears to have slowed considerably and heavy engineering is turning upwards. The institutional slide is continuing, but commercial’s tailspin is finally reversing.
The descent in private office buildings hasn’t relented, but after years of plummeting, retail has turned the corner. School/college starts, expressed as a trend line, are still in the doldrums. Hospitals/clinics, though, are moving sideways.
Roads/highways and water/sewage are heading upwards. Bridges, however, are on a downslope. Miscellaneous civil, after descending steeply (due to some mega projects dropping out of the 12-month moving average calculation), have moved into a holding pattern.
Y/Y Cost of Labor Wage Closing in on +5%
Tables B-3 and B-8 of the monthly Employment Situation report from the BLS record average hourly and average weekly wages for industry sectors. B-3 is for all employees (i.e., including bosses) on nonfarm payrolls. B-8 is for ‘production and non-supervisory personnel’ only (i.e., it excludes bosses). For ‘all jobs’ and construction, there are eight relevant percentage changes to consider.
From Table B3 (including bosses), ‘all jobs’ earnings y/y in August were +4.3% both hourly and weekly. For construction workers, as a subset of ‘all jobs,’ the compensation hikes were somewhat lower, but not by much, +3.9% hourly and +3.7% weekly. From Table B8 (excluding bosses), the ‘all jobs’ year-over-year earnings gains were +4.8% hourly and +5.4% weekly. Again, construction workers were left a little behind, +4.5% hourly, and +4.7% weekly.
There’s a significant takeaway from these compensation figures. Earlier during the past decade, wage increases, both generally and in construction, ranged between +2.0% and +3.0% y/y. They are now creeping towards +5.0% y/y. Lately, when considering the challenges facing the contracting community, there’s been a tendency to fixate on rising material costs. Also warranting a careful look, though, are rising charges for the other key input component, labor.
Graph 7: Average Hourly Earnings Y/Y – ‘All Jobs’ & Construction
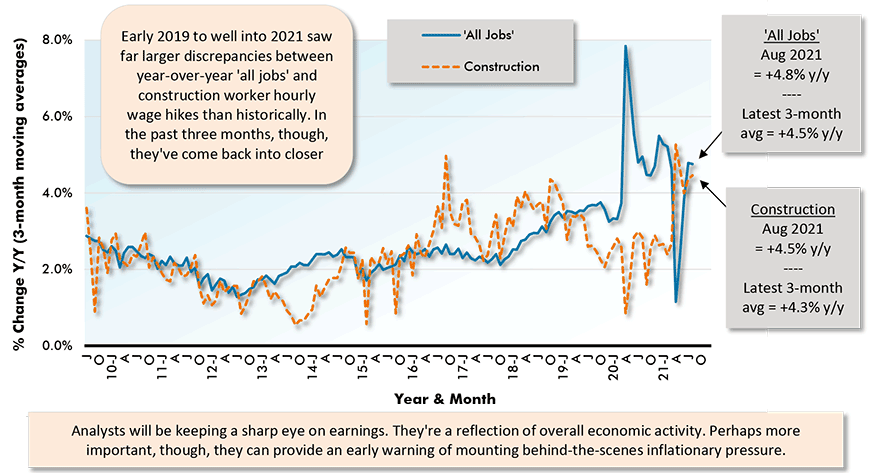
From ‘Production Workers and Non-supervisory Personnel’ Table (B8).
The latest data points are for August 2021
Data Source: Bureau of Labor Statistics (BLS)’s Employment Situation report.
Chart: ConstructConnect.
Graph 8: Average Weekly Earnings Y/Y – ‘All Jobs’ & Construction
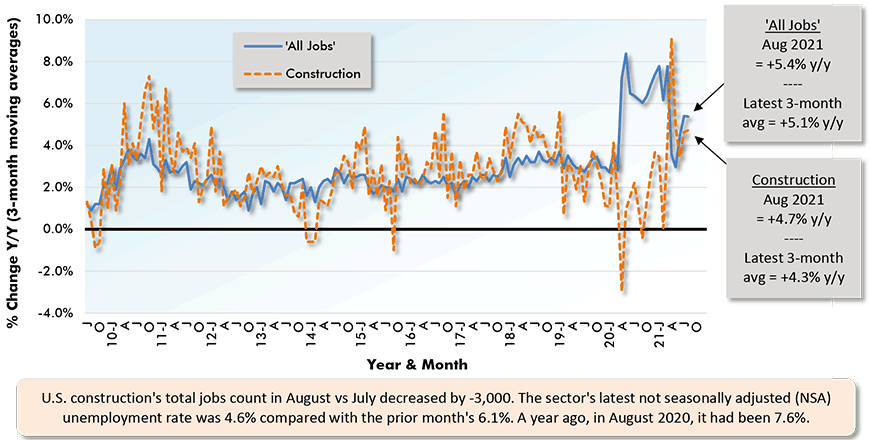
From ‘Production Workers and Nonsupervisory Personnel’ Table (B8).
The latest data points are for August 2021
Data Source: Bureau of Labor Statistics (BLS)’s Employment Situation report.
Chart: ConstructConnect.
Table 3: 2021 YTD Ranking of Top 20 States by $ Volume of Nonresidential Construction Starts – ConstructConnect
| Jan-AUG 2021 | % Change vs Jan-AUG 2020 | ||
| 1 | Texas | $32,264,339,105 | -5.9% |
| 2 | California | $23,273,084,894 | -15.2% |
| 3 | Florida | $15,527,201,089 | -2.3% |
| 4 | New York | $14,558,736,254 | 4.7% |
| 5 | Ohio | $10,262,825,266 | -11.6% |
| 6 | Pennsylvania | $9,451,559,782 | 29.0% |
| 7 | North Carolina | $8,951,907,524 | 24.1% |
| 8 | Illinois | $8,939,464,278 | -20.6% |
| 9 | Massachusetts | $8,593,616,299 | 22.8% |
| 10 | Georgia | $8,364,930,446 | -11.1% |
| 11 | Minnesota | $7,486,009,987 | 15.6% |
| 12 | Tennessee | $6,799,165,128 | 19.9% |
| 13 | Missouri | $6,773,389,232 | -9.1% |
| 14 | Michigan | $6,525,725,841 | 14.0% |
| 15 | Virginia | $6,337,808,322 | -19.5% |
| 16 | Washington | $5,721,659,702 | -48.3% |
| 17 | Arizona | $5,455,981,701 | -11.5% |
| 18 | Wisconsin | $5,316,485,037 | -24.6% |
| 19 | Indiana | $5,213,150,972 | -12.1% |
| 20 | Colorado | $5,181,292,940 | -4.0% |
Figures are comprised of non-res building & engineering (residential is omitted).
Data Source and Table: ConstructConnect.
Table 4: 2021 YTD Ranking of Top 20 States by $ Volume of Nonresidential Building Construction Starts – ConstructConnect
| Jan-AUG 2021 | % Change vs Jan-AUG 2020 | ||
| 1 | Texas | $18,672,229,026 | -18.5% |
| 2 | California | $13,063,579,760 | -7.4% |
| 3 | Florida | $9,613,241,227 | -7.7% |
| 4 | New York | $9,036,378,681 | -7.6% |
| 5 | North Carolina | $6,555,083,894 | 16.4% |
| 6 | Pennsylvania | $6,525,682,460 | 70.8% |
| 7 | Ohio | $6,251,244,382 | -19.3% |
| 8 | Georgia | $5,521,955,048 | -14.2% |
| 9 | Tennessee | $5,382,425,342 | 29.7% |
| 10 | Virginia | $4,522,447,724 | -5.3% |
| 11 | Arizona | $4,508,297,822 | -3.9% |
| 12 | Missouri | $4,490,484,541 | -20.7% |
| 13 | Illinois | $4,233,672,300 | -30.8% |
| 14 | Massachusetts | $3,821,745,607 | -26.0% |
| 15 | Washington | $3,567,211,527 | -25.1% |
| 16 | Alabama | $3,509,864,451 | 44.5% |
| 17 | Colorado | $3,316,505,655 | -6.9% |
| 18 | Maryland | $3,059,006,409 | -18.2% |
| 19 | Michigan | $2,856,436,093 | -13.9% |
| 20 | New Jersey | $2,840,012,643 | 7.0% |
Data Source and Table: ConstructConnect.
Table 5: 2021 YTD Ranking of Top 20 States by $ Volume of Heavy/Engineering Civil Construction Starts – ConstructConnect
| Jan-AUG 2021 | % Change vs Jan-AUG 2020 | ||
| 1 | Texas | $13,592,110,079 | 19.5% |
| 2 | California | $10,209,505,134 | -23.5% |
| 3 | Florida | $5,913,959,862 | 8.1% |
| 4 | New York | $5,522,357,573 | 33.8% |
| 5 | Minnesota | $5,451,842,973 | 59.1% |
| 6 | Massachusetts | $4,771,870,692 | 160.9% |
| 7 | Illinois | $4,705,791,978 | -8.5% |
| 8 | Ohio | $4,011,580,884 | 3.6% |
| 9 | Michigan | $3,669,289,748 | 52.4% |
| 10 | Pennsylvania | $2,925,877,322 | -16.6% |
| 11 | Wisconsin | $2,877,035,467 | 12.3% |
| 12 | Georgia | $2,842,975,398 | -4.4% |
| 13 | Indiana | $2,412,642,095 | -6.7% |
| 14 | North Carolina | $2,396,823,630 | 51.3% |
| 15 | Missouri | $2,282,904,691 | 28.0% |
| 16 | Washington | $2,154,448,175 | -65.8% |
| 17 | New Jersey | $2,136,808,473 | -15.2% |
| 18 | Iowa | $1,882,567,211 | -10.4% |
| 19 | Colorado | $1,864,787,285 | 1.5% |
| 20 | Maine | $1,821,080,242 | 120.0% |
Data Source and Table: ConstructConnect.
Lumber Prices Recede, Other Material Costs Skyrocket
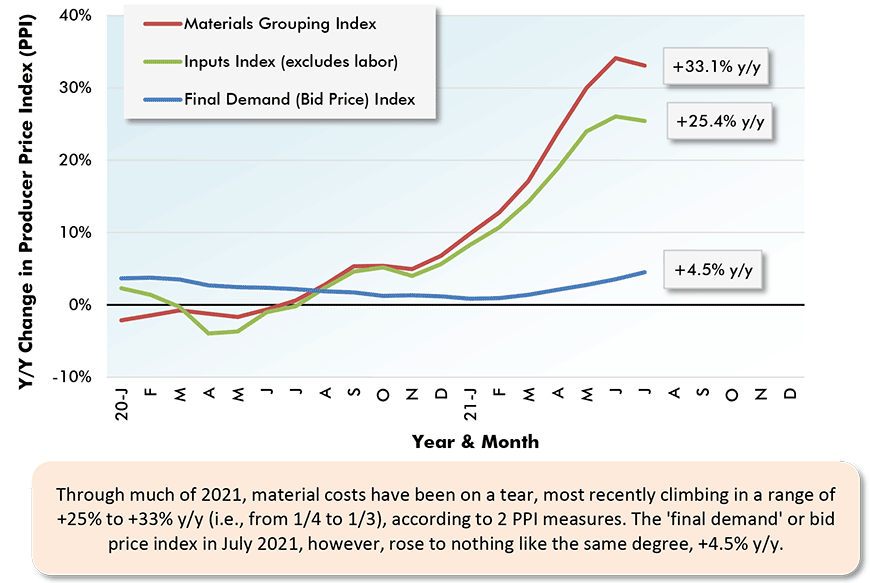
August 2021’s y/y results for three structures-related BLS Producer Price Index (PPI) series were as follows: ‘construction materials special index,’ +31.1% (an enormous increase, but not quite as high as July’s +33.1%); ‘inputs to new construction index, excluding capital investment, labor, and imports,’ +21.0% (again, a huge jump, but also a small step back from the previous month’s figure, +25.4%) and ‘final demand construction,’ designed to capture bid prices, +5.0% (a little more robust than July’s +4.5%).
Concerning the cost of some major construction material inputs, as revealed in the Producer Price Index (PPI) data set published by the Bureau of Labor Statistics (BLS), softwood lumber in August was -9.8% (it had been +154.3% just three months ago in May); hot rolled steel bars, plates, and structural shapes, +49.0% y/y; aluminum sheet and strip, +41.7%; copper wire and cable, +31.4%; and gypsum products, +22.9%.
The value of construction starts each month is derived from ConstructConnect’s database of all active construction projects in the United States. Missing project values are estimated with the help of RSMeans’ building cost models. ConstructConnect’s nonresidential construction starts series, because it is comprised of total-value estimates for individual projects, some of which are super-large, has a history of being more volatile than many other leading indicators for the economy.
Graph 9: U.S. Construction Bid Prices vs Material Input Costs – July 2021
Latest data points are for July 2021.
Chart: ConstructConnect.
Data source: Bureau of Labor Statistics, Producer Price Index data set.
Chart: ConstructConnect.
August 2021’s ‘Grand Total’ Starts +6.0% YTD
From Table 8 below, ConstructConnect’s total residential starts in August were +12.9% m/m, +25.9% y/y and +24.6% ytd. Multi-family starts are beginning to display some perkiness. In the latest month, they may have been -0.4% y/y, but they were +7.1% m/m and +6.4% ytd. Blazing the brightest trail, though, have been single-family starts, +14.4% m/m, +34.4% y/y and +31.9% ytd. Including home building with all nonresidential categories, Grand Total starts in August 2021 were -2.3% m/m, +4.5% y/y, and +6.0% ytd.
ConstructConnect adopts a research-assigned ‘start’ date. In concept, a ‘start’ is equivalent to ground being broken for a project to proceed. If work is abandoned or re-bid, the ‘start’ date is revised to reflect the new information.
Expansion Index Monitors Construction Prospects
The economy may be in recovery mode, but nonresidential work is usually a lagging player. Companies are hesitant to undertake capital spending until their personnel needs are rapidly expanding and their office square footage or plant footprints are straining capacity. Also, it helps if profits are abundant. (Today’s greater tendency to work from home has made office occupancy much more difficult to assess.)
Each month, ConstructConnect publishes information on upcoming construction projects at its Expansion Index.
The Expansion Index, for hundreds of cities in the United States and Canada, calculates the ratio, based on dollar volume, of projects in the planning stage, at present, divided by the comparable figure a year ago. The ratio moves above 1.0 when there is currently a larger dollar volume of construction ‘prospects’ than there was last year at the same time. The ratio sinks below 1.0 when the opposite is the case. The results are set out in interactive maps for both countries.
Click here to download the Construction Industry Snapshot Package – August 2021 PDF.
Click here for the Top 10 Project Starts in the U.S. – August 2021.
Click here for the Nonresidential Construction Starts Trend Graphs – August 2021.
TABLE 6: VALUE OF UNITED STATES NONRESIDENTIAL CONSTRUCTION STARTS
AUGUST 2021 – CONSTRUCTCONNECT
| % Change | % Change | % Change | ||||
| Jan-AUG 21 | Jan-AUG 21 vs | AUG 21 vs | AUG 21 vs | |||
| ($ billions) | Jan-AUG 20 | AUG 20 | JUL 21 | |||
| Hotel/Motel | 4.502 | -42.3% | -29.6% | -40.4% | ||
| Retail | 9.137 | 8.1% | 31.9% | 85.4% | ||
| Parking Garage | 1.261 | -1.2% | -12.9% | -9.7% | ||
| Amusement | 4.762 | 12.8% | 53.5% | -50.6% | ||
| Private Office | 11.722 | -32.3% | -29.7% | 37.2% | ||
| Government Office | 8.365 | 24.3% | 37.6% | -42.6% | ||
| Laboratory | 1.400 | -1.4% | 139.6% | 23.6% | ||
| Warehouse | 15.605 | -13.9% | -30.2% | 4.3% | ||
| Miscellaneous Commercial* | 5.941 | 11.1% | -10.8% | 112.9% | ||
| COMMERCIAL (big subset) | 62.695 | -11.3% | -10.1% | 0.9% | ||
| INDUSTRIAL (Manufacturing) | 12.955 | -11.5% | -74.5% | -57.4% | ||
| Religious | 0.651 | -37.5% | 38.3% | 299.7% | ||
| Hospital/Clinic | 11.106 | 27.4% | -35.9% | -19.5% | ||
| Nursing/Assisted Living | 3.973 | -19.5% | -34.7% | 95.6% | ||
| Library/Museum | 1.726 | -44.3% | -52.0% | -66.6% | ||
| Police/Courthouse/Prison | 5.104 | 1.3% | -36.6% | 2.6% | ||
| Military | 5.614 | -3.4% | -1.1% | -3.3% | ||
| School/College | 43.676 | -15.1% | -1.3% | 10.4% | ||
| Miscellaneous Medical | 4.192 | -24.3% | -10.6% | 19.8% | ||
| INSTITUTIONAL | 76.044 | -11.2% | -12.5% | 6.7% | ||
| Miscellaneous Nonresidential | 3.931 | 4.6% | -22.4% | -28.4% | ||
| NONRESIDENTIAL BUILDING | 155.625 | -10.9% | -20.6% | -3.5% | ||
| Airport | 3.888 | -4.6% | 12.4% | 43.0% | ||
| Road/Highway | 48.873 | 6.6% | 14.3% | -26.5% | ||
| Bridge | 13.036 | -23.5% | 24.5% | -5.0% | ||
| Dam/Marine | 4.462 | -18.7% | -3.1% | 35.9% | ||
| Water/Sewage | 23.949 | 11.2% | 16.1% | -11.2% | ||
| Miscellaneous Civil (power, pipelines, etc.) | 18.095 | 3.6% | -27.3% | -62.3% | ||
| HEAVY ENGINEERING (Civil) | 112.302 | 0.8% | 7.3% | -25.9% | ||
| TOTAL NONRESIDENTIAL | 267.927 | -6.4% | -11.1% | -14.2% |
*Includes transportation terminals and sports arenas.
Source: ConstructConnect Research Group and ConstructConnect.
Table: ConstructConnect.
TABLE 7: VALUE OF UNITED STATES CONSTRUCTION STARTS
CONSTRUCTCONNECT INSIGHT VERSION – JULY 2021
Arranged to match the alphabetical category drop-down menus in INSIGHT
| % Change | % Change | % Change | ||||||
| Jan-Aug 21 | Jan-Aug 21 vs | Aug 21 vs | Aug 21 vs | |||||
| ($ billions) | Jan-Aug 20 | Jul 20 | Jul 21 | |||||
| Summary | ||||||||
| CIVIL | 112.302 | 0.8% | 7.3% | -25.9% | ||||
| NONRESIDENTIAL BUILDING | 155.625 | -10.9% | -20.6% | -3.5% | ||||
| RESIDENTIAL | 238.201 | 24.6% | 25.9% | 12.9% | ||||
| GRAND TOTAL | 506.128 | 6.0% | 4.5% | -2.3% | ||||
| Verticals | ||||||||
| Airport | 3.888 | -4.6% | 12.4% | 43.0% | ||||
| All Other Civil | 10.759 | -25.6% | -18.4% | 14.9% | ||||
| Bridges | 13.036 | -23.5% | 24.5% | -5.0% | ||||
| Dams / Canals / Marine Work | 4.462 | -18.7% | -3.1% | 35.9% | ||||
| Power Infrastructure | 7.335 | 144.4% | -74.6% | -97.0% | ||||
| Roads | 48.873 | 6.6% | 14.3% | -26.5% | ||||
| Water and Sewage Treatment | 23.949 | 11.2% | 16.1% | -11.2% | ||||
| CIVIL | 112.302 | 0.8% | 7.3% | -25.9% | ||||
| Offices (private) | 11.722 | -32.3% | -29.7% | 37.2% | ||||
| Parking Garages | 1.261 | -1.2% | -12.9% | -9.7% | ||||
| Transportation Terminals | 2.925 | 81.5% | 31.2% | 26.5% | ||||
| Commercial (small subset) | 15.908 | -21.3% | -26.2% | 32.6% | ||||
| Amusement | 4.762 | 12.8% | 53.5% | -50.6% | ||||
| Libraries / Museums | 1.726 | -44.3% | -52.0% | -66.6% | ||||
| Religious | 0.651 | -37.5% | 38.3% | 299.7% | ||||
| Sports Arenas / Convention Centers | 3.016 | -19.3% | -24.9% | 255.4% | ||||
| Community | 10.155 | -16.1% | -1.8% | -24.4% | ||||
| College / University | 10.034 | -15.4% | 26.8% | 24.9% | ||||
| Elementary / Pre School | 12.506 | -21.4% | -19.1% | 6.4% | ||||
| Jr / Sr High School | 19.936 | -10.3% | -4.5% | 6.8% | ||||
| Special / Vocational | 1.201 | -18.3% | -18.2% | -25.5% | ||||
| Educational | 43.676 | -15.1% | -1.3% | 10.4% | ||||
| Courthouses | 1.688 | 42.0% | -36.1% | -67.7% | ||||
| Fire and Police Stations | 1.933 | -10.2% | -14.3% | 50.4% | ||||
| Government Offices | 8.365 | 24.3% | 37.6% | -42.6% | ||||
| Prisons | 1.483 | -12.6% | -49.8% | 108.7% | ||||
| Government | 13.469 | 14.5% | -1.6% | -32.5% | ||||
| Industrial Labs / Labs / School Labs | 1.400 | -1.4% | 139.6% | 23.6% | ||||
| Manufacturing | 12.955 | -11.5% | -74.5% | -57.4% | ||||
| Warehouses | 15.605 | -13.9% | -30.2% | 4.3% | ||||
| Industrial | 29.960 | -12.4% | -52.7% | -27.7% | ||||
| Hospitals / Clinics | 11.106 | 27.4% | -35.9% | -19.5% | ||||
| Medical Misc. | 4.192 | -24.3% | -10.6% | 19.8% | ||||
| Nursing Homes | 3.973 | -19.5% | -34.7% | 95.6% | ||||
| Medical | 19.272 | 0.4% | -29.8% | 9.0% | ||||
| Military | 5.614 | -3.4% | -1.1% | -3.3% | ||||
| Hotels | 4.502 | -42.3% | -29.6% | -40.4% | ||||
| Retail Misc. | 3.931 | 4.6% | -22.4% | -28.4% | ||||
| Shopping | 9.137 | 8.1% | 31.9% | 85.4% | ||||
| Retail | 17.570 | -12.2% | 3.5% | 12.6% | ||||
| NONRESIDENTIAL BUILDING | 155.625 | -10.9% | -20.6% | -3.5% | ||||
| Multi-Family | 57.751 | 6.4% | -0.4% | 7.1% | ||||
| Single-Family | 180.450 | 31.9% | 34.4% | 14.4% | ||||
| RESIDENTIAL | 238.201 | 24.6% | 25.9% | 12.9% | ||||
| NONRESIDENTIAL | 267.927 | -6.4% | -11.1% | -14.2% | ||||
| GRAND TOTAL | 506.128 | 6.0% | 4.5% | -2.3% | ||||
Table 2 conforms to the type-of-structure ordering adopted by many firms and organizations in the industry. Specifically, it breaks nonresidential building into ICI work (i.e., industrial, commercial, and institutional), since each has its own set of economic and demographic drivers. Table 3 presents an alternative, perhaps more user-friendly and intuitive type-of-structure ordering that matches how the data appears in ConstructConnect Insight.
Source: ConstructConnect.
Table: ConstructConnect.
TABLE 8: VALUE OF UNITED STATES NATIONAL CONSTRUCTION STARTS – JULY 2021 – CONSTRUCTCONNECT
Billions of current $s, not seasonally adjusted (NSA)
| Latest month actuals | Moving averages (placed in end month) | Year to Date. | |||||||||
| 3-months | 12-months | JAN-AUG | JAN-AUG | ||||||||
| JUN 21 | JUL 21 | AUG 21 | JUN 21 | JUL 21 | AUG 21 | JUN 21 | JUL 21 | AUG 21 | 2020 | 2021 | |
| Single Family | 25.650 | 24.114 | 27.580 | 23.614 | 24.244 | 25.781 | 21.037 | 21.321 | 21.909 | 136.836 | 180.450 |
| month-over-month % change | 11.7% | -6.0% | 14.4% | 3.2% | 2.7% | 6.3% | 2.8% | 1.4% | 2.8% | ||
| year-over-year % change | 36.2% | 16.5% | 34.4% | 49.0% | 34.0% | 28.8% | 28.1% | 28.3% | 30.0% | 2.6% | 31.9% |
| Apartment | 7.210 | 6.149 | 6.584 | 8.146 | 6.983 | 6.648 | 7.158 | 7.077 | 7.075 | 54.300 | 57.751 |
| month-over-month % change | -5.0% | -14.7% | 7.1% | 0.7% | -14.3% | -4.8% | -0.4% | -1.1% | 0.0% | ||
| year-over-year % change | -4.2% | -13.6% | -0.4% | 24.4% | -1.0% | -6.2% | -10.1% | -11.7% | -8.9% | -9.7% | 6.4% |
| TOTAL RESIDENTIAL | 32.860 | 30.263 | 34.164 | 31.760 | 31.227 | 32.429 | 28.195 | 28.398 | 28.984 | 191.136 | 238.201 |
| month-over-month % change | 7.5% | -7.9% | 12.9% | 2.5% | -1.7% | 3.9% | 2.0% | 0.7% | 2.1% | ||
| year-over-year % change | 24.7% | 8.8% | 25.9% | 41.8% | 24.2% | 19.6% | 15.6% | 15.3% | 17.7% | -1.2% | 24.6% |
| Hotel/Motel | 0.814 | 0.703 | 0.419 | 0.662 | 0.698 | 0.645 | 0.599 | 0.593 | 0.578 | 7.801 | 4.502 |
| month-over-month % change | 41.1% | -13.6% | -40.4% | 12.6% | 5.4% | -7.5% | 4.3% | -1.0% | -2.5% | ||
| year-over-year % change | 56.5% | -9.2% | -29.6% | 5.3% | 25.0% | 2.5% | -60.8% | -59.5% | -58.5% | -46.6% | -42.3% |
| Retail | 1.493 | 0.815 | 1.510 | 1.280 | 1.177 | 1.273 | 1.069 | 1.050 | 1.081 | 8.449 | 9.137 |
| month-over-month % change | 22.0% | -45.5% | 85.4% | 9.7% | -8.0% | 8.1% | 3.7% | -1.8% | 2.9% | ||
| year-over-year % change | 44.8% | -21.6% | 31.9% | 31.3% | 19.5% | 18.7% | -3.5% | -4.0% | 0.4% | -29.8% | 8.1% |
| Parking Garages | 0.114 | 0.177 | 0.160 | 0.097 | 0.138 | 0.151 | 0.139 | 0.146 | 0.144 | 1.276 | 1.261 |
| month-over-month % change | -6.8% | 55.7% | -9.7% | -14.8% | 42.5% | 9.2% | -0.5% | 4.7% | -1.4% | ||
| year-over-year % change | -6.6% | 78.6% | -12.9% | -27.8% | -3.5% | 11.5% | -28.7% | -16.2% | -15.6% | -46.8% | -1.2% |
| Amusement | 0.674 | 1.131 | 0.559 | 0.531 | 0.776 | 0.788 | 0.491 | 0.554 | 0.570 | 4.222 | 4.762 |
| month-over-month % change | 28.9% | 67.9% | -50.6% | 3.8% | 46.2% | 1.5% | 2.3% | 12.8% | 2.9% | ||
| year-over-year % change | 24.1% | 199.2% | 53.5% | -0.3% | 77.5% | 83.9% | -22.9% | -2.3% | 2.5% | -17.9% | 12.8% |
| Office | 0.847 | 1.887 | 2.589 | 1.084 | 1.254 | 1.774 | 1.727 | 1.774 | 1.683 | 17.321 | 11.722 |
| month-over-month % change | -17.7% | 122.8% | 37.2% | -16.0% | 15.7% | 41.5% | -4.0% | 2.7% | -5.1% | ||
| year-over-year % change | -50.5% | 43.1% | -29.7% | -31.5% | -8.9% | -20.7% | -36.0% | -29.7% | -35.7% | -22.9% | -32.3% |
| Governmental Offices | 0.796 | 2.140 | 1.228 | 0.902 | 1.306 | 1.388 | 0.890 | 0.997 | 1.025 | 6.731 | 8.365 |
| month-over-month % change | -19.0% | 168.9% | -42.6% | -3.4% | 44.8% | 6.3% | -1.0% | 12.1% | 2.8% | ||
| year-over-year % change | -11.9% | 151.9% | 37.6% | 8.2% | 59.4% | 57.4% | -9.3% | 9.8% | 16.0% | -14.5% | 24.3% |
| Laboratories | 0.179 | 0.236 | 0.292 | 0.137 | 0.182 | 0.236 | 0.169 | 0.176 | 0.191 | 1.420 | 1.400 |
| month-over-month % change | 38.6% | 31.7% | 23.6% | -12.9% | 32.3% | 29.8% | -2.2% | 4.6% | 8.0% | ||
| year-over-year % change | -20.2% | 64.3% | 139.6% | 10.4% | 22.9% | 44.3% | -21.1% | -18.9% | -1.9% | -5.6% | -1.4% |
| Warehouse | 1.929 | 1.575 | 1.642 | 2.350 | 1.831 | 1.715 | 2.044 | 2.024 | 1.964 | 18.131 | 15.605 |
| month-over-month % change | -2.9% | -18.3% | 4.3% | -7.1% | -22.1% | -6.3% | -3.4% | -1.0% | -2.9% | ||
| year-over-year % change | -30.8% | -13.5% | -30.2% | -8.6% | -20.6% | -26.1% | -3.8% | -5.8% | -7.6% | 19.4% | -13.9% |
| Misc Commercial | 2.573 | 0.303 | 0.645 | 1.184 | 1.089 | 1.173 | 0.683 | 0.629 | 0.622 | 5.348 | 5.941 |
| month-over-month % change | 556.6% | -88.2% | 112.9% | 88.0% | -8.0% | 7.7% | 32.9% | -7.9% | -1.0% | ||
| year-over-year % change | 374.0% | -68.2% | -10.8% | 118.8% | 63.9% | 58.7% | -41.9% | -38.6% | -37.9% | -61.6% | 11.1% |
| TOTAL COMMERCIAL | 9.419 | 8.968 | 9.045 | 8.228 | 8.451 | 9.144 | 7.811 | 7.944 | 7.859 | 70.699 | 62.695 |
| month-over-month % change | 35.2% | -4.8% | 0.9% | 3.9% | 2.7% | 8.2% | 1.1% | 1.7% | -1.1% | ||
| year-over-year % change | 12.4% | 21.6% | -10.1% | 3.9% | 13.6% | 6.2% | -26.7% | -21.5% | -21.6% | -25.7% | -11.3% |
| TOTAL INDUSTRIAL (Manufacturing) | 1.115 | 2.097 | 0.892 | 1.431 | 1.728 | 1.368 | 1.796 | 1.876 | 1.659 | 14.638 | 12.955 |
| month-over-month % change | -43.5% | 88.0% | -57.4% | -34.5% | 20.7% | -20.8% | 1.5% | 4.5% | -11.6% | ||
| year-over-year % change | 38.8% | 85.1% | -74.5% | -15.3% | 14.0% | -24.5% | -44.5% | -29.4% | -13.4% | -69.2% | -11.5% |
| Religious | 0.085 | 0.037 | 0.148 | 0.085 | 0.069 | 0.090 | 0.105 | 0.100 | 0.104 | 1.043 | 0.651 |
| month-over-month % change | -0.1% | -56.1% | 299.7% | -9.2% | -18.6% | 30.9% | -3.1% | -4.2% | 3.4% | ||
| year-over-year % change | -32.4% | -58.8% | 38.3% | -20.6% | -39.0% | -16.3% | -26.8% | -27.8% | -22.9% | -20.8% | -37.5% |
| Hosptials/Clinics | 1.875 | 0.965 | 0.776 | 1.156 | 1.131 | 1.205 | 1.360 | 1.345 | 1.309 | 8.715 | 11.106 |
| month-over-month % change | 239.2% | -48.5% | -19.5% | -36.8% | -2.2% | 6.6% | 5.4% | -1.1% | -2.7% | ||
| year-over-year % change | 80.2% | -15.5% | -35.9% | 14.2% | 1.8% | 6.6% | -20.2% | -13.3% | -10.2% | -33.0% | 27.4% |
| Nursing/Assisted Living | 0.826 | 0.264 | 0.516 | 0.628 | 0.553 | 0.536 | 0.577 | 0.566 | 0.543 | 4.934 | 3.973 |
| month-over-month % change | 45.4% | -68.0% | 95.6% | 11.2% | -11.9% | -3.1% | 3.1% | -1.9% | -4.0% | ||
| year-over-year % change | 33.2% | -33.1% | -34.7% | 7.2% | 11.5% | -11.0% | -13.1% | -11.6% | -19.3% | -23.6% | -19.5% |
| Libraries/Museums | 0.229 | 0.341 | 0.114 | 0.226 | 0.306 | 0.228 | 0.195 | 0.204 | 0.194 | 3.097 | 1.726 |
| month-over-month % change | -34.3% | 48.6% | -66.6% | -1.8% | 35.3% | -25.6% | -3.9% | 4.8% | -5.0% | ||
| year-over-year % change | -29.5% | 48.5% | -52.0% | -27.6% | 2.7% | -13.7% | -51.5% | -46.5% | -50.5% | 25.5% | -44.3% |
| Police/Courthouse/Prison | 0.878 | 0.619 | 0.635 | 0.668 | 0.674 | 0.711 | 0.708 | 0.710 | 0.679 | 5.038 | 5.104 |
| month-over-month % change | 67.5% | -29.5% | 2.6% | 26.5% | 0.8% | 5.5% | 4.5% | 0.2% | -4.3% | ||
| year-over-year % change | 71.7% | 3.0% | -36.6% | 43.1% | 33.2% | 0.8% | 16.1% | 13.5% | 3.3% | 23.4% | 1.3% |
| Military | 1.248 | 0.645 | 0.624 | 0.741 | 0.873 | 0.839 | 0.748 | 0.752 | 0.752 | 5.811 | 5.614 |
| month-over-month % change | 71.6% | -48.3% | -3.3% | 16.6% | 17.9% | -3.9% | 7.1% | 0.6% | -0.1% | ||
| year-over-year % change | 90.2% | 8.8% | -1.1% | -28.5% | 50.3% | 33.9% | 13.7% | 11.0% | 7.0% | 139.0% | -3.4% |
| Schools/Colleges | 7.739 | 5.185 | 5.725 | 6.701 | 6.442 | 6.216 | 5.074 | 4.981 | 4.975 | 51.465 | 43.676 |
| month-over-month % change | 20.9% | -33.0% | 10.4% | 19.3% | -3.9% | -3.5% | -3.0% | -1.8% | -0.1% | ||
| year-over-year % change | -19.5% | -17.7% | -1.3% | -13.2% | -16.8% | -14.1% | -14.3% | -15.3% | -15.3% | -9.5% | -15.1% |
| Misc Government | 0.728 | 0.438 | 0.524 | 0.616 | 0.541 | 0.563 | 0.607 | 0.576 | 0.571 | 5.538 | 4.192 |
| month-over-month % change | 59.0% | -39.9% | 19.8% | 18.5% | -12.1% | 4.1% | 3.7% | -5.1% | -0.9% | ||
| year-over-year % change | 55.4% | -46.0% | -10.6% | -2.4% | -23.6% | -9.4% | -14.0% | -20.3% | -18.8% | -14.0% | -24.3% |
| TOTAL INSTITUTIONAL | 13.608 | 8.493 | 9.063 | 10.819 | 10.588 | 10.388 | 9.374 | 9.235 | 9.127 | 85.639 | 76.044 |
| month-over-month % change | 40.8% | -37.6% | 6.7% | 8.0% | -2.1% | -1.9% | 0.2% | -1.5% | -1.2% | ||
| year-over-year % change | 1.8% | -16.4% | -12.5% | -8.9% | -8.4% | -8.0% | -13.3% | -13.0% | -13.9% | -8.0% | -11.2% |
| Misc Non Residential | 0.443 | 0.538 | 0.385 | 0.525 | 0.541 | 0.455 | 0.490 | 0.503 | 0.493 | 3.757 | 3.931 |
| month-over-month % change | -30.9% | 21.2% | -28.4% | -2.2% | 3.1% | -15.9% | -1.6% | 2.6% | -1.8% | ||
| year-over-year % change | -17.8% | 39.3% | -22.4% | 15.0% | 20.9% | -3.9% | -16.9% | -12.1% | -12.3% | -19.6% | 4.6% |
| TOTAL NONRES BUILDING | 24.585 | 20.095 | 19.385 | 21.003 | 21.308 | 21.355 | 19.470 | 19.557 | 19.138 | 174.733 | 155.625 |
| month-over-month % change | 27.8% | -18.3% | -3.5% | 1.7% | 1.5% | 0.2% | 0.6% | 0.4% | -2.1% | ||
| year-over-year % change | 6.5% | 5.5% | -20.6% | -4.3% | 1.7% | -3.8% | -23.0% | -18.4% | -17.1% | -27.3% | -10.9% |
| Airports | 0.823 | 0.568 | 0.811 | 0.661 | 0.715 | 0.734 | 0.489 | 0.479 | 0.487 | 4.076 | 3.888 |
| month-over-month % change | 8.9% | -31.1% | 43.0% | 45.7% | 8.3% | 2.6% | -1.1% | -2.0% | 1.6% | ||
| year-over-year % change | -7.6% | -17.0% | 12.4% | 13.9% | 1.3% | -4.1% | -12.9% | -9.8% | -9.0% | -19.3% | -4.6% |
| Roads/Highways | 6.802 | 8.104 | 5.959 | 7.228 | 7.545 | 6.955 | 5.309 | 5.491 | 5.553 | 45.851 | 48.873 |
| month-over-month % change | -12.0% | 19.1% | -26.5% | 4.0% | 4.4% | -7.8% | -0.5% | 3.4% | 1.1% | ||
| year-over-year % change | -4.2% | 37.0% | 14.3% | 0.6% | 14.2% | 14.4% | -3.9% | 2.4% | 4.0% | -2.6% | 6.6% |
| Bridges | 1.546 | 1.493 | 1.419 | 1.735 | 1.566 | 1.486 | 1.594 | 1.539 | 1.563 | 17.045 | 13.036 |
| month-over-month % change | -6.9% | -3.4% | -5.0% | -3.5% | -9.7% | -5.1% | -6.8% | -3.4% | 1.5% | ||
| year-over-year % change | -47.4% | -30.3% | 24.5% | -22.8% | -33.7% | -28.4% | -27.7% | -30.5% | -26.9% | -21.0% | -23.5% |
| Dams/Marine | 0.659 | 0.575 | 0.781 | 0.567 | 0.569 | 0.672 | 0.604 | 0.607 | 0.605 | 5.489 | 4.462 |
| month-over-month % change | 39.4% | -12.9% | 35.9% | 8.0% | 0.4% | 18.0% | -0.2% | 0.5% | -0.3% | ||
| year-over-year % change | -2.3% | 6.6% | -3.1% | -24.8% | -17.9% | -0.2% | -11.4% | -10.8% | -14.8% | -0.5% | -18.7% |
| Water/Sewage | 3.293 | 3.498 | 3.108 | 3.188 | 3.489 | 3.300 | 2.717 | 2.768 | 2.803 | 21.530 | 23.949 |
| month-over-month % change | -10.4% | 6.2% | -11.2% | 6.2% | 9.4% | -5.4% | -0.5% | 1.9% | 1.3% | ||
| year-over-year % change | -4.5% | 20.9% | 16.1% | 10.6% | 22.1% | 9.8% | 2.2% | 4.6% | 4.0% | 3.5% | 11.2% |
| Misc Civil | 1.710 | 4.200 | 1.584 | 1.763 | 2.356 | 2.498 | 1.852 | 1.989 | 1.940 | 17.471 | 18.095 |
| month-over-month % change | 47.9% | 145.6% | -62.3% | 2.0% | 33.7% | 6.0% | -1.4% | 7.4% | -2.5% | ||
| year-over-year % change | -15.3% | 64.6% | -27.3% | -25.1% | -15.5% | 11.0% | -47.8% | -45.3% | -35.6% | -36.5% | 3.6% |
| TOTAL ENGINEERING | 14.834 | 18.438 | 13.662 | 15.141 | 16.240 | 15.645 | 12.564 | 12.873 | 12.950 | 111.462 | 112.302 |
| month-over-month % change | -4.0% | 24.3% | -25.9% | 4.7% | 7.3% | -3.7% | -1.5% | 2.5% | 0.6% | ||
| year-over-year % change | -13.1% | 25.2% | 7.3% | -5.4% | 1.4% | 5.4% | -17.2% | -14.6% | -10.2% | -12.6% | 0.8% |
| GRAND TOTAL | 72.278 | 68.796 | 67.211 | 67.904 | 68.775 | 69.429 | 60.229 | 60.829 | 61.072 | 477.330 | 506.128 |
| month-over-month % change | 10.8% | -4.8% | -2.3% | 2.8% | 1.3% | 1.0% | 0.8% | 1.0% | 0.4% | ||
| year-over-year % change | 8.7% | 11.7% | 4.5% | 12.5% | 10.7% | 8.2% | -7.1% | -4.5% | -1.7% | -15.0% | 6.0% |
| NONRES BLDG + ENGINEERING | 39.419 | 38.533 | 33.047 | 36.143 | 37.548 | 37.000 | 32.034 | 32.430 | 32.088 | 286.195 | 267.927 |
| month-over-month % change | 13.6% | -2.2% | -14.2% | 2.9% | 3.9% | -1.5% | -0.2% | 1.2% | -1.1% | ||
| year-over-year % change | -1.9% | 14.1% | -11.1% | -4.7% | 1.6% | -0.1% | -20.9% | -16.9% | -14.5% | -22.2% | -6.4% |
Data Source and Table: ConstructConnect.
TABLE 9: U.S. YEAR-TO-DATE REGIONAL STARTS,
NONRESIDENTIAL CONSTRUCTION* — CONSTRUCTCONNECT
| JAN-AUG 2020 | JAN-AUG 2021 | % Change | |||
| Connecticut | $2,843,650,515 | $1,996,933,100 | -29.8% | ||
| Maine | $1,288,684,345 | $2,409,156,193 | 86.9% | ||
| Massachusetts | $6,995,413,539 | $8,593,616,299 | 22.8% | ||
| New Hampshire | $741,164,746 | $1,009,945,714 | 36.3% | ||
| Rhode Island | $593,660,957 | $685,893,568 | 15.5% | ||
| Vermont | $455,333,478 | $305,297,293 | -33.0% | ||
| Total New England | $12,917,907,580 | $15,000,842,167 | 16.1% | ||
| New Jersey | $5,173,329,302 | $4,976,821,116 | -3.8% | ||
| New York | $13,904,106,268 | $14,558,736,254 | 4.7% | ||
| Pennsylvania | $7,326,290,112 | $9,451,559,782 | 29.0% | ||
| Total Middle Atlantic | $26,403,725,682 | $28,987,117,152 | 9.8% | ||
| TOTAL NORTHEAST | $39,321,633,262 | $43,987,959,319 | 11.9% | ||
| Illinois | $11,262,666,670 | $8,939,464,278 | -20.6% | ||
| Indiana | $5,933,823,807 | $5,213,150,972 | -12.1% | ||
| Michigan | $5,725,881,574 | $6,525,725,841 | 14.0% | ||
| Ohio | $11,615,876,332 | $10,262,825,266 | -11.6% | ||
| Wisconsin | $7,055,419,041 | $5,316,485,037 | -24.6% | ||
| Total East North Central | $41,593,667,424 | $36,257,651,394 | -12.8% | ||
| Iowa | $3,889,446,678 | $3,861,445,843 | -0.7% | ||
| Kansas | $3,416,439,119 | $2,120,682,054 | -37.9% | ||
| Minnesota | $6,476,503,133 | $7,486,009,987 | 15.6% | ||
| Missouri | $7,449,229,681 | $6,773,389,232 | -9.1% | ||
| Nebraska | $3,396,863,519 | $2,648,488,493 | -22.0% | ||
| North Dakota | $1,974,228,655 | $1,702,204,011 | -13.8% | ||
| South Dakota | $886,155,715 | $1,480,383,960 | 67.1% | ||
| Total West North Central | $27,488,866,500 | $26,072,603,580 | -5.2% | ||
| TOTAL MIDWEST | $69,082,533,924 | $62,330,254,974 | -9.8% | ||
| Delaware | $1,296,104,341 | $766,361,515 | -40.9% | ||
| District of Columbia | $636,612,002 | $682,664,032 | 7.2% | ||
| Florida | $15,885,653,482 | $15,527,201,089 | -2.3% | ||
| Georgia | $9,409,376,502 | $8,364,930,446 | -11.1% | ||
| Maryland | $4,921,936,313 | $3,865,890,056 | -21.5% | ||
| North Carolina | $7,215,567,991 | $8,951,907,524 | 24.1% | ||
| South Carolina | $3,819,474,356 | $3,669,395,030 | -3.9% | ||
| Virginia | $7,877,815,597 | $6,337,808,322 | -19.5% | ||
| West Virginia | $1,844,905,885 | $789,472,420 | -57.2% | ||
| Total South Atlantic | $52,907,446,469 | $48,955,630,434 | -7.5% | ||
| Alabama | $3,556,945,608 | $4,890,473,014 | 37.5% | ||
| Kentucky | $2,356,373,956 | $2,470,456,863 | 4.8% | ||
| Mississippi | $2,132,587,952 | $1,542,281,369 | -27.7% | ||
| Tennessee | $5,671,920,370 | $6,799,165,128 | 19.9% | ||
| Total East South Central | $13,717,827,886 | $15,702,376,374 | 14.5% | ||
| Arkansas | $2,846,558,338 | $1,758,780,121 | -38.2% | ||
| Louisiana | $3,289,145,370 | $3,583,354,125 | 8.9% | ||
| Oklahoma | $2,849,326,968 | $3,033,835,353 | 6.5% | ||
| Texas | $34,274,870,141 | $32,264,339,105 | -5.9% | ||
| Total West South Central | $43,259,900,817 | $40,640,308,704 | -6.1% | ||
| TOTAL SOUTH | $109,885,175,172 | $105,298,315,512 | -4.2% | ||
| Arizona | $6,161,545,716 | $5,455,981,701 | -11.5% | ||
| Colorado | $5,398,025,209 | $5,181,292,940 | -4.0% | ||
| Idaho | $1,075,828,374 | $907,837,325 | -15.6% | ||
| Montana | $1,172,487,166 | $769,137,213 | -34.4% | ||
| Nevada | $2,945,088,295 | $2,914,755,884 | -1.0% | ||
| New Mexico | $1,413,349,360 | $1,361,256,962 | -3.7% | ||
| Utah | $5,100,107,689 | $3,625,941,498 | -28.9% | ||
| Wyoming | $730,323,398 | $749,524,350 | 2.6% | ||
| Total Mountain | $23,996,755,207 | $20,965,727,873 | -12.6% | ||
| Alaska | $951,801,177 | $851,896,167 | -10.5% | ||
| California | $27,453,741,184 | $23,273,084,894 | -15.2% | ||
| Hawaii | $1,388,978,162 | $1,433,894,070 | 3.2% | ||
| Oregon | $3,048,903,264 | $4,063,864,612 | 33.3% | ||
| Washington | $11,065,058,104 | $5,721,659,702 | -48.3% | ||
| Total Pacific | $43,908,481,891 | $35,344,399,445 | -19.5% | ||
| TOTAL WEST | $67,905,237,098 | $56,310,127,318 | -17.1% | ||
| TOTAL U.S. | $286,194,579,456 | $267,926,657,123 | -6.4% |
*Figures above are comprised of nonres building and engineering (i.e., residential is omitted).
Data Source and Table: ConstructConnect.


Responses