
Finally, Megaprojects Galore
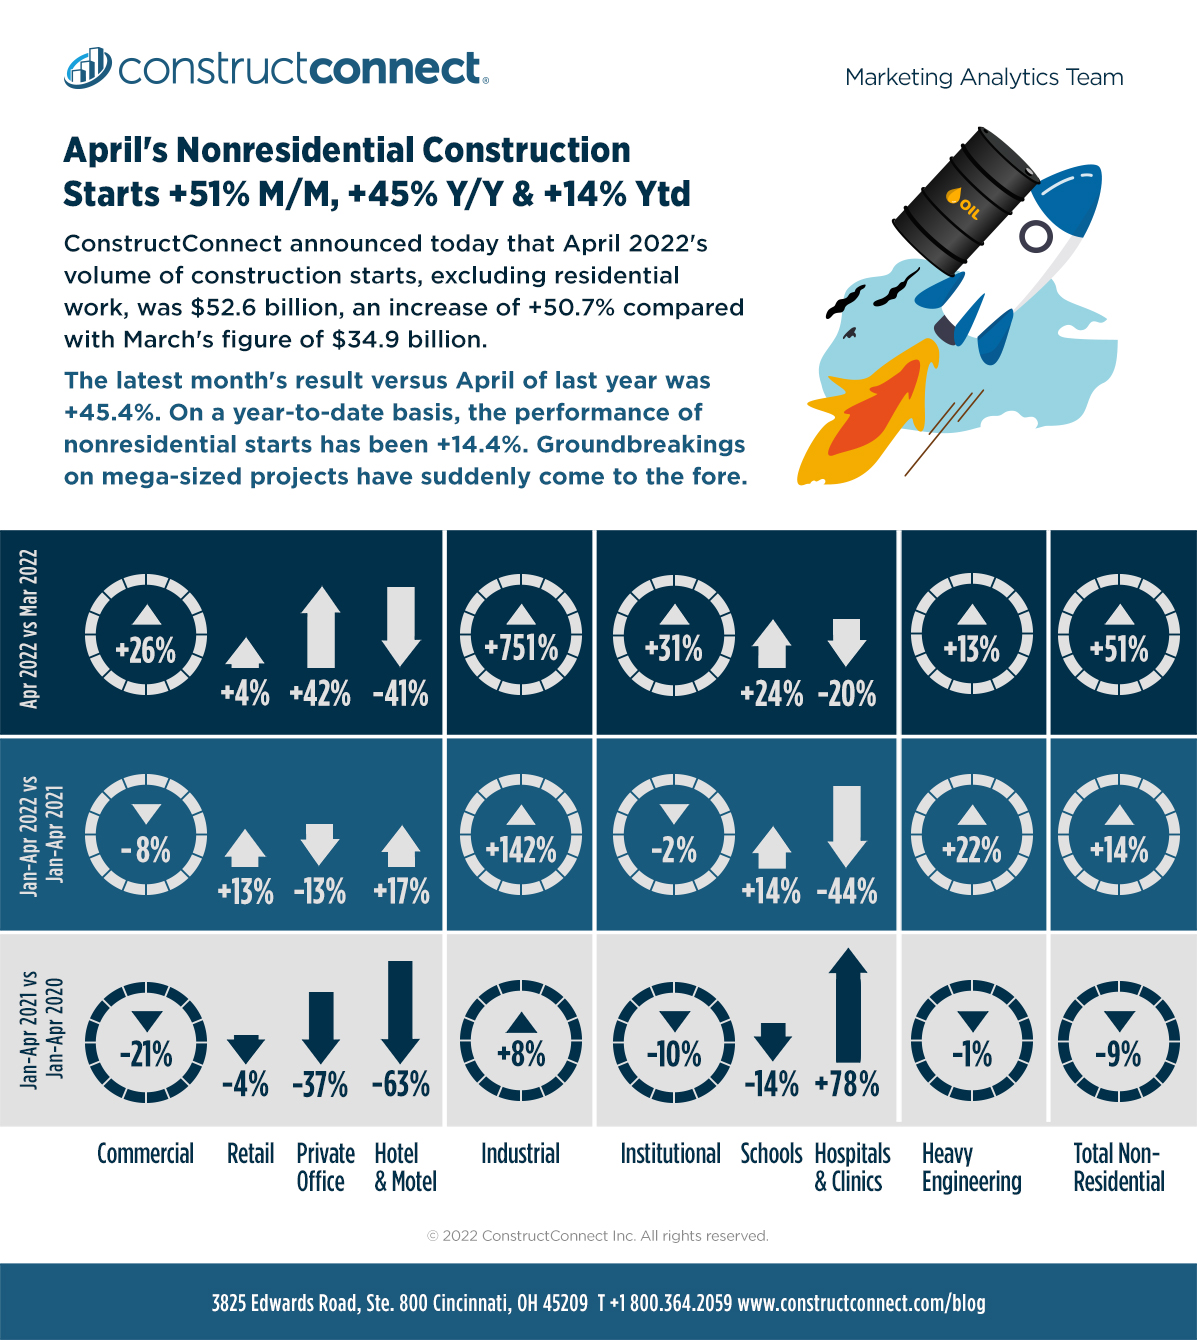
ConstructConnect announced today that April 2022’s volume of construction starts, excluding residential work, was $52.6 billion, an increase of +50.7% (i.e., by half) versus March’s figure of $34.9 billion (previously reported as $34.4 billion).
The latest month’s result, however, was -7.9% versus March of last year. As for year-to-date, the performance of nonresidential starts has been flat, +0.8%, relative to January-March 2021.
View this information as an infographic.
Click here to download the complete Construction Industry Snapshot Package – April 2022 PDF.
In April, groundbreakings on mega-sized projects, valued at a billion dollars or more each, suddenly came to the fore. There were five such undertakings, summing to a value of $17.1 billion. The five projects accounted for nearly a third (32.5%) of April’s total nonresidential starts. The biggest of the five was Tellurian’s Driftwood LNG production and exporting facility south of Lake Charles in Louisiana. The construction component, separate from equipment, has been estimated by ConstructConnect at $10 billion.
Among the elite projects (see Table 8), there was also a bridge (‘Portal’ in New Jersey, across the Hackensack River) and drydock work at the naval shipyard in Portsmouth, Maine.
There’s an impressive array of huge projects in the planning stage. Almost certainly upcoming are billions of dollars to be spent on auto plants to produce electric vehicles, and on new battery-making plants, plus computer chip facilities, and additions to steelmaking capacity. Furthermore, much of this work is not optional. It will need to proceed for the major corporations behind these plans to achieve, by 2030-2035, the net-zero polluting goals they have set for themselves.
January to April in both 2021 and 2022 featured six mega projects. But the half dozen megaprojects last year combined for $9.9 billion, well short of this year’s $19.1 billion.
GRAND TOTAL starts in April 2022 (i.e., adding residential to nonresidential activity) were +30.0% m/m, +25.4% y/y and +10.9% ytd.
No Longer Is It All About Residential
There are three major subcategories of total starts: residential, nonresidential building, and heavy engineering/civil. On a year-to-date percentage-change basis in April, engineering starts were liveliest, at +21.6%. Next in line were nonresidential building groundbreakings, +9.6%, although residential starts weren’t far behind, +7.0%.
On a month-to-month basis in April, nonresidential building starts (which included the LNG megaproject within its industrial subcategory) were way out in front, +84.2%. Engineering, +13.3%, and residential, +7.3%, performed solidly but were left in nonresidential building’s dust.
Trailing 12-Month Starts Stats
Other statistics often beloved by analysts are trailing twelve-month (TTM) results and these are set out for all the various type-of-structure categories in Table 10.
Grand Total TTM starts in April 2022 on a month-to-month basis were +2.3%, which was a turnaround from March’s -0.3% and an improvement over February’s +0.8%.
On a year-over-year basis in April 2022, GT TTM starts were +10.4%, better than March’s +9.9%, but a tad short of February’s +11.8%.
Residential Surpasses Nonresidential as Share of PIP Total
Starts compile the total estimated dollar value and square footage of all projects on which ground is broken in any given month. They lead, by nine months to as much as two years, put-in-place (PIP) statistics which are analogous to work-in-progress payments as the building of structures proceeds to completion.
PIP numbers cover the universe of construction, new plus all manner of renovation activity, with residential traditionally making up two-fifths (about 40%) of the total and nonresidential, three-fifths (i.e., the bigger portion, at around 60%). Or at least that’s the way things used to be.
Over the past couple of years, against a pandemic backdrop, the residential-to-nonresidential mix has undergone a seismic shift. In full-year 2021, the relationship was about 50-50. Through Q1 of 2022, in the PIP statistics, residential has taken over as the leader, maybe for the first time ever. Its share of total has risen to 51.0%, pushing nonresidential back to 49.0%.
The January-March 2022 over January-March 2021 total dollar volume of PIP construction was +12.0%, with residential at +18.6% and nonresidential, +5.8%. In coming months and moving into 2023 and beyond, nonresidential is expected to rear up again, especially with the help of megaprojects, and retake a mild dollar-level ascendancy over residential.
PIP numbers, being more spread out, have smaller peak-over-trough percent-change amplitudes than the starts series. As an additional valuable service for clients and powered by its extensive starts database, ConstructConnect, in partnership with Oxford Economics, a world leader in econometric modeling, has developed put-in-place construction statistics by types of structure for U.S. states, cities, and counties, actuals, and forecasts. ConstructConnect’s PIP numbers are being released quarterly and are featured in a separate report.
Construction’s Unemployment Rate Drops Further
U.S. total jobs creation since the beginning of this year has been outstanding at a monthly average of plus half a million (+518,000). The construction sector’s average month-to-month climb in employment so far in 2022 has been far less spectacular, only +21,000. In the individual month of April, the gain in construction employment barely registered, at just +2,000 jobs.
Nevertheless, construction’s not seasonally adjusted unemployment rate has dropped further to 4.6% in latest April from 6.0% in March and 8.6% in year-ago April.
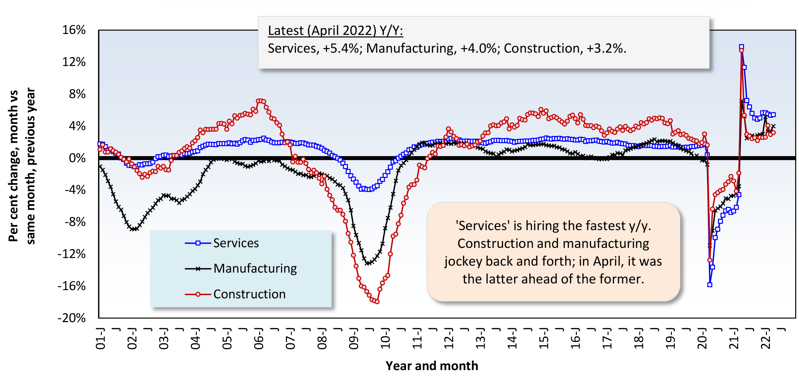
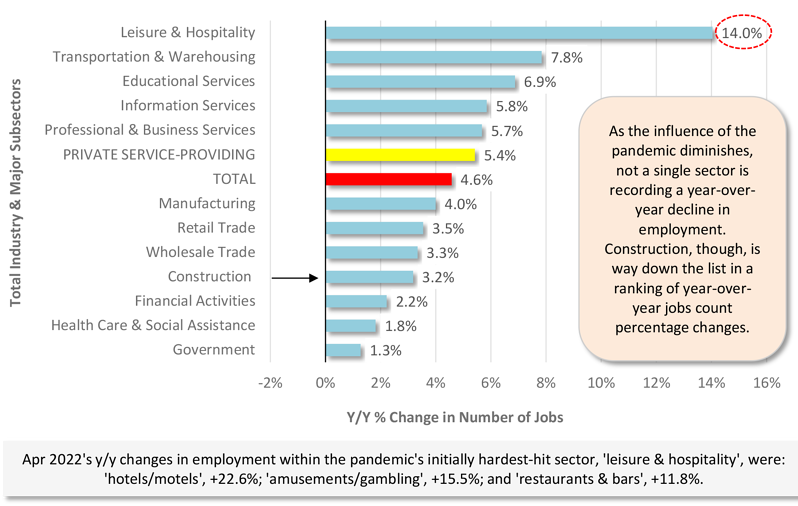
Construction’s year-over-year employment growth has been +3.2% compared with +4.6% for all jobs; +4.0% for manufacturing; and +14.0% for the leisure and hospitality sector.
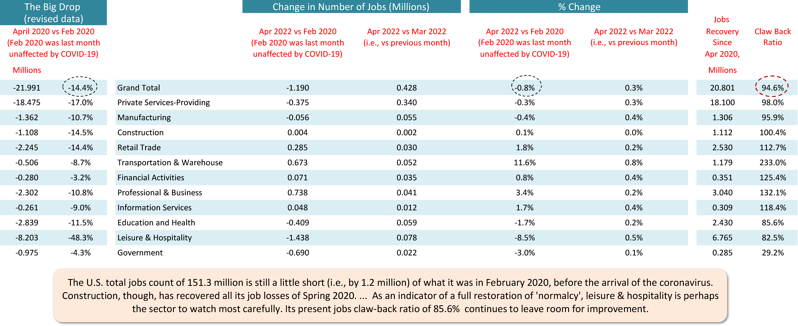
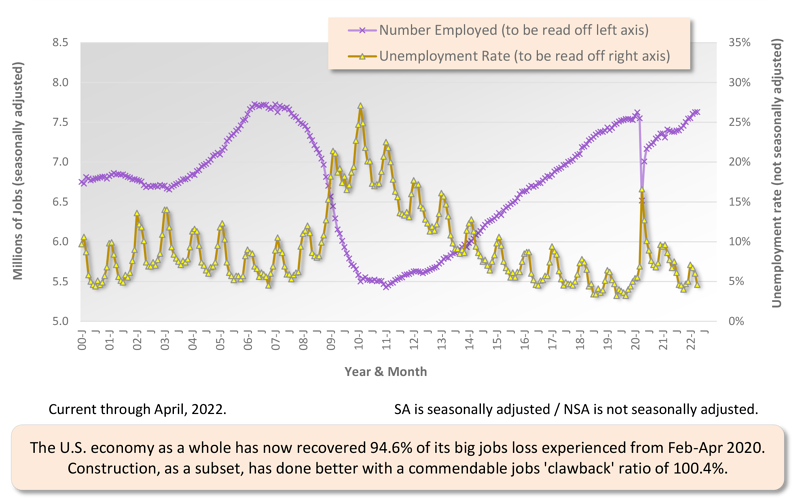
Construction does have a leg up, though, versus all jobs with respect to its clawback ratio. Construction has now recovered 100.4% of the big drop in employment it suffered from Feb-Apr 2000, when COVID-19 initially sent shock waves up and down the economy. The all jobs recovery ratio, at 94.6%, still leaves something to be desired.
In other segments of the economy with close ties to construction, the latest y/y percentage changes in employment have been: oil and gas exploration and extraction, +17.4%; machinery and equipment rental and leasing, +9.2%; architectural and engineering design services, +5.7%; real estate, +4.1%; cement and concrete product manufacturing, +2.3%; and building materials and supplies dealers, -1.9%.
Graph 1: Change in Level of U.S. Construction Employment, Month to Month (M/M) −
Total & by Categories – April 2022
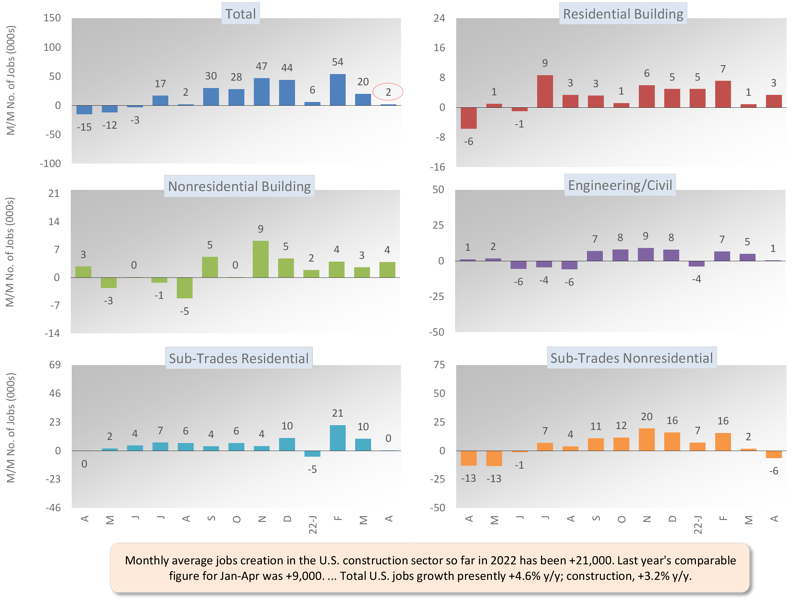
Table 2: Monitoring the U.S. Employment Recovery – April 2022
Graph 2: U.S. Employment April 2022 – % Change Y/Y
Based on Seasonally Adjusted (SA) Data
Graph 3: Y/Y Jobs Change, U.S. Total Industry & Major Subsectors — April 2022 (Based on Seasonally Adjusted Payroll Data)
Graph 4: U.S. Construction Employment (SA) & Unemployment Rate (NSA)
Pluses and Minuses Among the Type of Structure Subcategories
April 2022’s +50.7% month-to-month (m/m) increase in total nonresidential starts resulted primarily from a big surge in industrial (+751.3%); but it wouldn’t do to overlook solid contributions from institutional (+31.0%) and commercial (+26.2%) as well. Nor did engineering fail to deliver (+13.3%).
The +45.4% performance of total nonresidential starts in April of this year versus April of last year was also driven mainly by industrial (+850.7%), with additional backing from institutional (+29.2%) and engineering (+21.5%), while commercial (-6.7%) staged a mild retreat.
As for April’s year-to-date gain of +14.4% for total nonresidential starts, it was won with the support of industrial (+142.3%) and engineering (+21.6%), and in opposition to the direction taken by commercial (-7.6%) and institutional (-1.6%).
There are two dominant subcategories of total nonresidential starts. When the volumes of roads/highways and schools/colleges are added together, they accounted for more than one-third of total year-to-date nonresidential activity in April 2022 (i.e., shares of 19.1% and 15.3% respectively, summing to 34.4%).
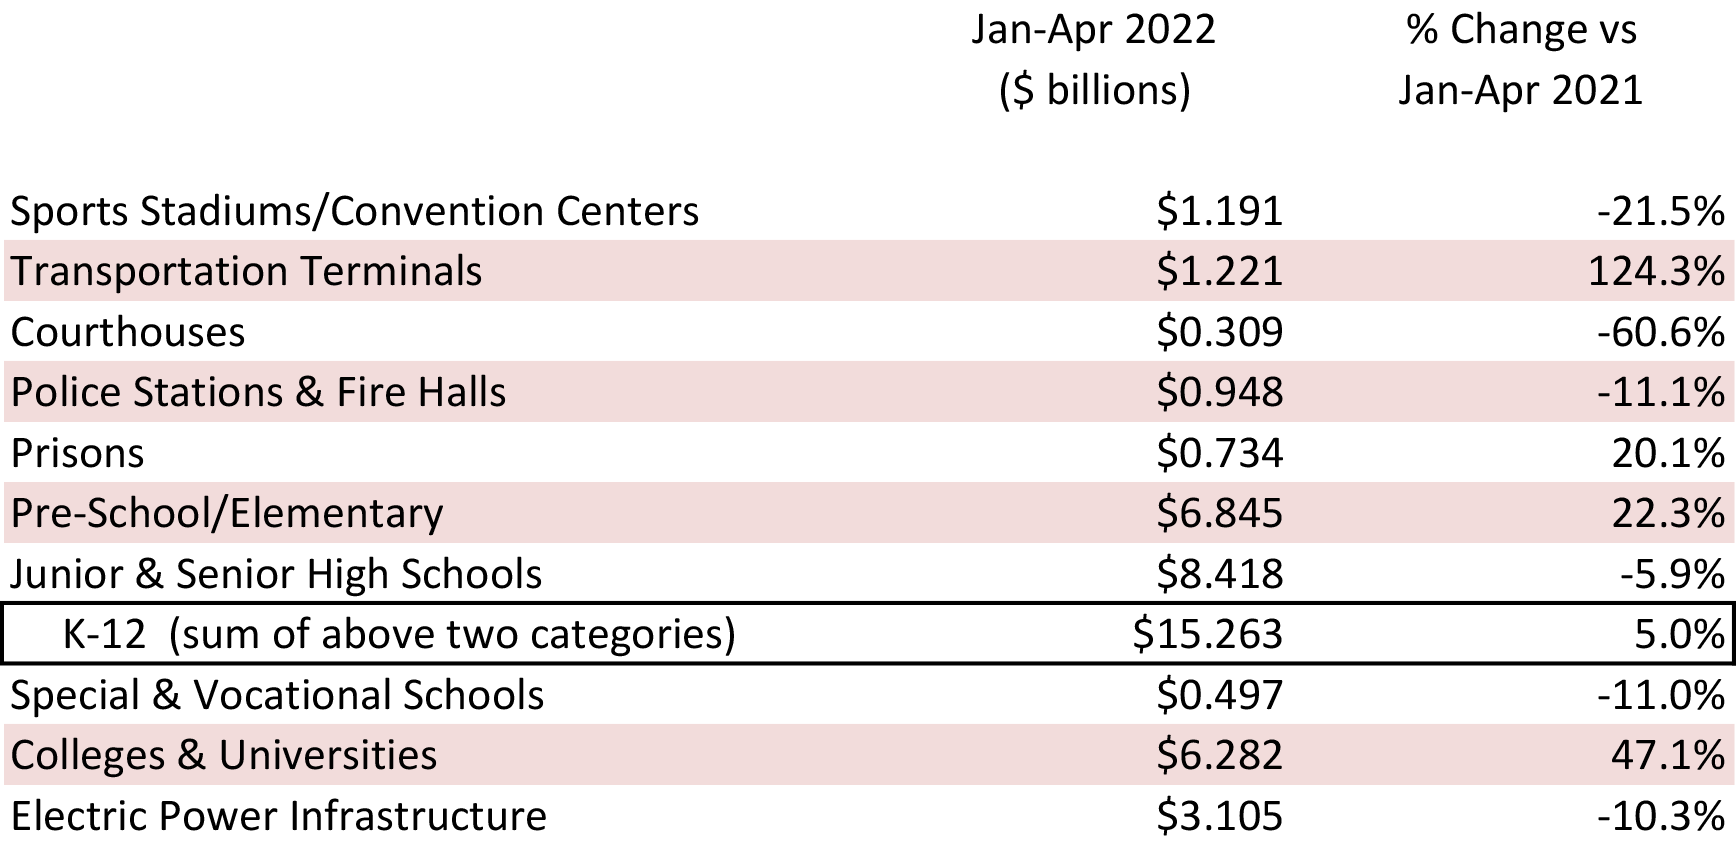
The three percentage-change metrics for street starts in April 2022 were all positive: +4.6% m/m, +15.2% y/y and +34.7% ytd. The same was true for school starts: +24.1% m/m; +17.8% y/y; and +13.8% ytd. Looking deeper into school starts, they were +47.1% ytd for colleges and universities; +22.3% ytd for earliest education and elementary; and -5.9% ytd for junior and senior high schools.
Water and sewage starts may have been -5.7% m/m in April, but they were +36.6% y/y and +19.4% ytd. Bridge starts in the latest month were +109.1% m/m, +94.0% y/y and +37.7% ytd.
For the three medical subcategories combined, i.e., hospital/clinic, nursing/assisted living, and miscellaneous medical, April 2022’s starts continued to be disappointing, -15.7% m/m, -24.9% y/y, and -34.8% ytd. Hospital/clinic starts on their own were -43.9% ytd; and nursing/assisted living starts were also weak, -26.1% ytd.
With combat raging in Ukraine and the world geopolitical order under severe strain, starts categorized as military have seen a substantial pickup this year: +407.3% m/m; +873.0% y/y; and +34.9% ytd.
Among commercial starts in April, and on a ytd basis, the hotel/motel, retail/shopping, amusement, and miscellaneous (which includes transportation terminals) sub-categories have been encouragingly upbeat, +17.4%, +12.7%, +19.7%, and +17.0% respectively. Private office buildings and warehouses remain in the doldrums, -12.7% ytd and -34.2% ytd, although they both turned in nice m/m gains in the latest month, +42.0% and +37.2% respectively.
Table 3: Construction Starts in Some Additional Type of Structure Subcategories
Trend Graphs Flat to Rising
This Industry Snapshot showcases a dozen type-of-structure trend graphs. The trends are captured by taking 12-month moving averages of ConstructConnect’s starts statistics.
As for recent movement in the curves in the graphs, there would seem to be three ways to describe them. Types of structures that are displaying a flattening are retail, private office buildings, hospitals/clinics, and miscellaneous civil. Those that are turning up are schools/colleges and bridges. And those that are continuing in an upwards direction are roads/highways and water/sewage.
JOLTS and the Wage Increase Effect
For the entire economy, the latest workforce report from the Bureau of Labor Statistics says there are currently 5.5 million Americans (NSA) who are unemployed. Compare that figure with the 11.5 million positions that are said to be vacant in the Job Openings and Labor Turnover Survey report. There’s good reason to believe today’s low national unemployment rate will be fixed in place for some time to come.
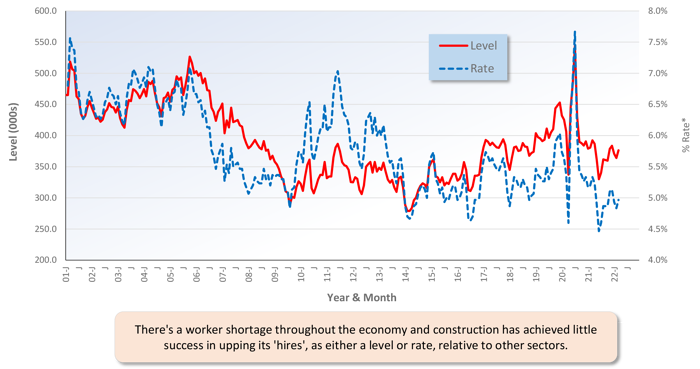
For ease of viewing, Graphs 5 and 6 show ‘smoothed’ curves (i.e., based on three-month moving averages) for the JOLTS results, openings and hires, pertaining to construction.
Openings in construction are extremely elevated, but hires remain historically depressed. The construction sector is in a contest with most other sectors throughout the economy to resolve a worker shortage problem. One might suppose that compensation increases would form an active front in this battle. On that score, however, construction is not leading the charge.
Among 12 major sectors, construction is presently ninth for year-over-year increase in hourly earnings and eighth for y/y increase in weekly earnings. The two sectors that are leading the earnings advances are leisure and hospitality and transportation and warehousing.
Graph 5: U.S. Construction Job Openings (from JOLTS Report)
(3-month Moving Averages placed in Latest Month)

Graph 6: U.S. Construction Job Hires (from JOLTS Report)
(3-month Moving Averages placed in Latest Month)
Construction Falling Behind Other Sectors on Pay Front
Tables B-3 and B-8 of the monthly Employment Situation report, from the BLS, record average hourly and average weekly wages for industry sectors. B-3 is for all employees (i.e., including bosses) on nonfarm payrolls. B-8 is for production and nonsupervisory personnel only (i.e., it excludes bosses). For all jobs and construction, there are eight relevant percentage changes to consider.
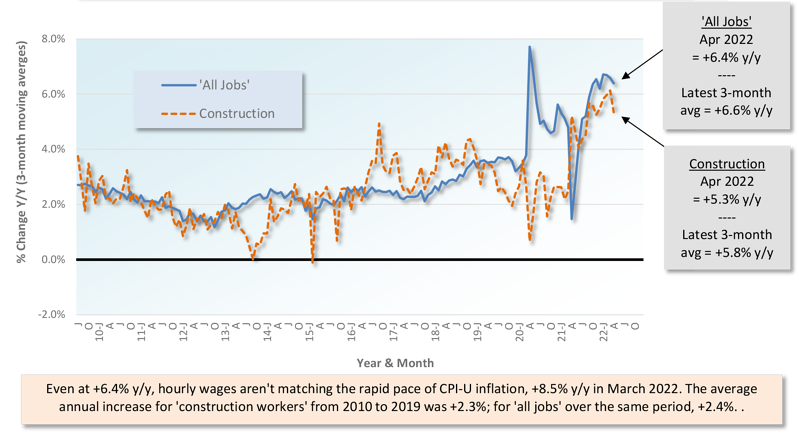
From April 2022’s Table B-3 (including bosses), year-over-year all-jobs earnings were +5.5% hourly and +4.6% weekly. Construction workers kept even hourly, +5.5%, and did a little better weekly, +4.9%. From Table B-8 for production and nonsupervisory workers (i.e., excluding bosses), the all-jobs compensation gains were +6.4% hourly and +5.5% weekly. Construction workers fell somewhat short on both counts, +5.3% hourly and +4.8% weekly.
To provide some perspective, and again pulling the data from Table B-8 of the BLS report, April’s y/y hourly wage increase for leisure and hospitality workers was +12.6% and for transportation and warehousing workers, +10.8%. Both were double-digit percentage gains.
Graph 7: Average Hourly Earnings Y/Y – All Jobs & Construction
Graph 8: Average Weekly Earnings Y/Y – All Jobs & Construction
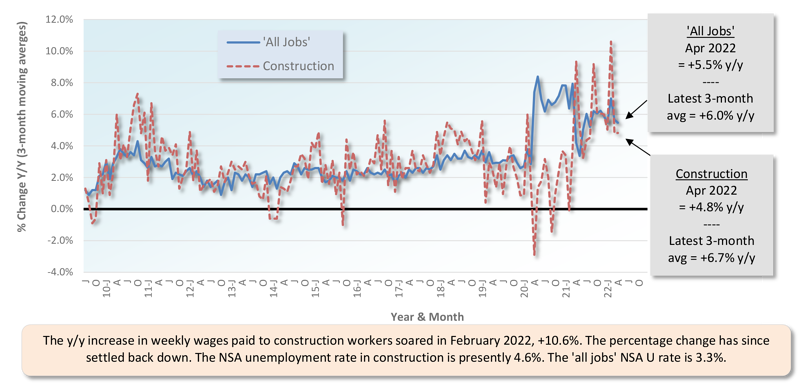
Table 4: 2022 YTD Ranking of Top 20 States by $ Volume of Nonresidential Construction Starts — ConstructConnect®
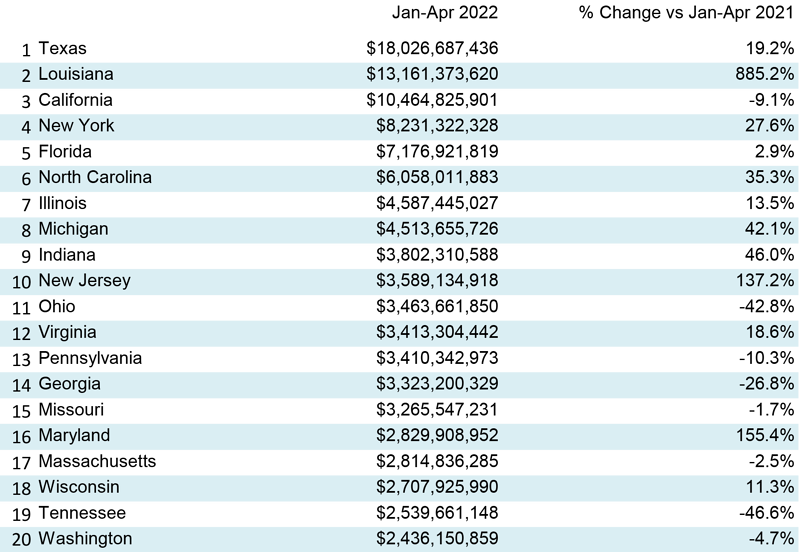
Table 5: 2022 YTD Ranking of Top 20 States by $ Volume of Nonresidential Building Construction Starts — ConstructConnect®
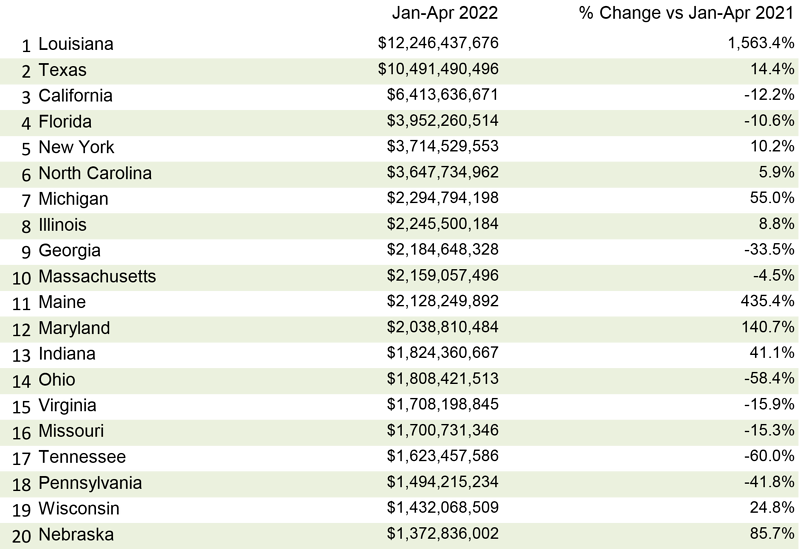
Table 6: 2022 YTD Ranking of Top 20 States by $ Volume of Heavy Engineering/Civil Construction Starts — ConstructConnect®

Y/Y Bid Prices & Material Costs Come into Alignment
April’s y/y results for three building related BLS Producer Price Index (PPI) series were: (A) construction materials special index, +17.9% (significantly down from March’s +24.6%); (B) inputs to new construction index, excluding capital investment, labor, and imports, +20.9% (also down in a big way versus its previous month’s advance, +23.0%); and (C) final demand construction, designed to capture bid prices, +19.6% (a sizable jump from March’s +16.6%).
(A) comes from a data series with a long history, but it’s confined to a limited number of major construction materials. (B) has a shorter history, but it’s more comprehensive in its coverage, although it includes some items (e.g., transportation) that aren’t strictly materials.
Concerning the cost of some major construction material inputs, as revealed in the PPI data set published by the BLS, diesel fuel is +86.5% y/y; aluminum sheet and strip, +45.2%; asphalt, +39.9%; hot rolled steel bars, plates, and structural shapes, +38.3%; gypsum, +17.8%; copper wire and cable, +14.1%; ready-mix concrete, +8.8%; cement, +6.9%; and softwood lumber, -5.5%. There’s also an inputs to highways and streets PPI index and it’s +21.0% y/y.
The value of construction starts each month is derived from ConstructConnect’s database of all active construction projects in the United States. Missing project values are estimated with the help of RSMeans’ building cost models. ConstructConnect’s nonresidential construction starts series, because it is comprised of total-value estimates for individual projects, some of which are super-large, have a history of being more volatile than many other leading indicators for the economy.
April 2022’s Grand Total Starts +10.9% YTD
ConstructConnect’s total residential starts in April 2022 were +7.3% m/m, +3.4% y/y and +7.0% ytd. Multi-family starts in April were +23.1% m/m, -7.9% y/y and +2.0% ytd. Single-family starts were +1.9% m/m, +8.8% y/y and +9.1% ytd.
Including home building with all nonresidential categories, Grand Total starts in April 2022 were +30.0% m/m, +25.4% y/y and +10.9% ytd.
ConstructConnect adopts a research-assigned start date. In concept, a start is equivalent to ground being broken for a project to proceed. If work is abandoned or rebid, the start date is revised to reflect the new information.
Risk Assessment as a Precaution
Economic headwinds strengthened in April and May, underpinned by the Federal Reserve taking strong initial steps to reduce recent inflation readings which have exceeded +8% y/y for the first time in 40 years. Businesses must prepare for a world of far higher borrowing costs.
The ramifications on the construction industry are likely to be significant as higher borrowing costs will reduce expected returns on investment. This makes it critical for every construction firm to know not only their own ROI for every project but also the financial strength of the companies they serve. Construction firms that are cash rich, carrying minimal or no debt, are still subject to indirect risk from the owners and developers they work with, if they are financing the cost of construction.
In a May survey conducted by ConstructConnect of construction firms and building product manufacturers, over 40% stated they are encountering either more, or many more, owners who are delaying or suspending projects due to rising material and labor costs. The added pressure of higher financing costs will only worsen the risk of more projects being stalled. – Michael Guckes, Senior Economist
Expansion Index Monitors Construction Prospects
The economy may be in recovery mode, but nonresidential work is usually a lagging player. Companies are hesitant to undertake capital spending until their personnel needs are rapidly expanding and their office square footage or plant footprints are straining capacity. Also, it helps if profits are abundant. (Today’s greater tendency to work from home has made office occupancy much more difficult to assess.)
Each month, ConstructConnect publishes information on upcoming construction projects at its Expansion Index.
The Expansion Index, for hundreds of cities in the United States and Canada, calculates the ratio, based on dollar volume, of projects in the planning stage, at present, divided by the comparable figure a year ago. The ratio moves above 1.0 when there is currently a larger dollar volume of construction ‘prospects’ than there was last year at the same time. The ratio sinks below 1.0 when the opposite is the case. The results are set out in interactive maps for both countries.
Click here to download the Construction Industry Snapshot Package – April 2022 PDF.
Click here for the Top 10 Project Starts in the U.S. – April 2022.
Click here for the Nonresidential Construction Starts Trend Graphs – April 2022.
Table 1: Value of United States Nonresidential Construction Starts April 2022 – ConstrucConnect

*Includes transportation terminals and sports arenas.
Source: ConstructConnect Research Group and ConstructConnect.
Table: ConstructConnect.
Table 7: Value of United States Construction Starts
ConstructConnect Insight Version – April 2022
Arranged to match the alphabetical category drop-down menus in Insight

Table 2 conforms to the type-of-structure ordering adopted by many firms and organizations in the industry. Specifically, it breaks nonresidential building into ICI work (i.e., industrial, commercial, and institutional), since each has its own set of economic and demographic drivers. Table 3 presents an alternative, perhaps more user-friendly and intuitive type-of-structure ordering that matches how the data appears in ConstructConnect Insight.
Source: ConstructConnect.
Table: ConstructConnect.
Table 9: U.S. YTD Regional Starts
Nonresidential Construction* — ConstructConnect
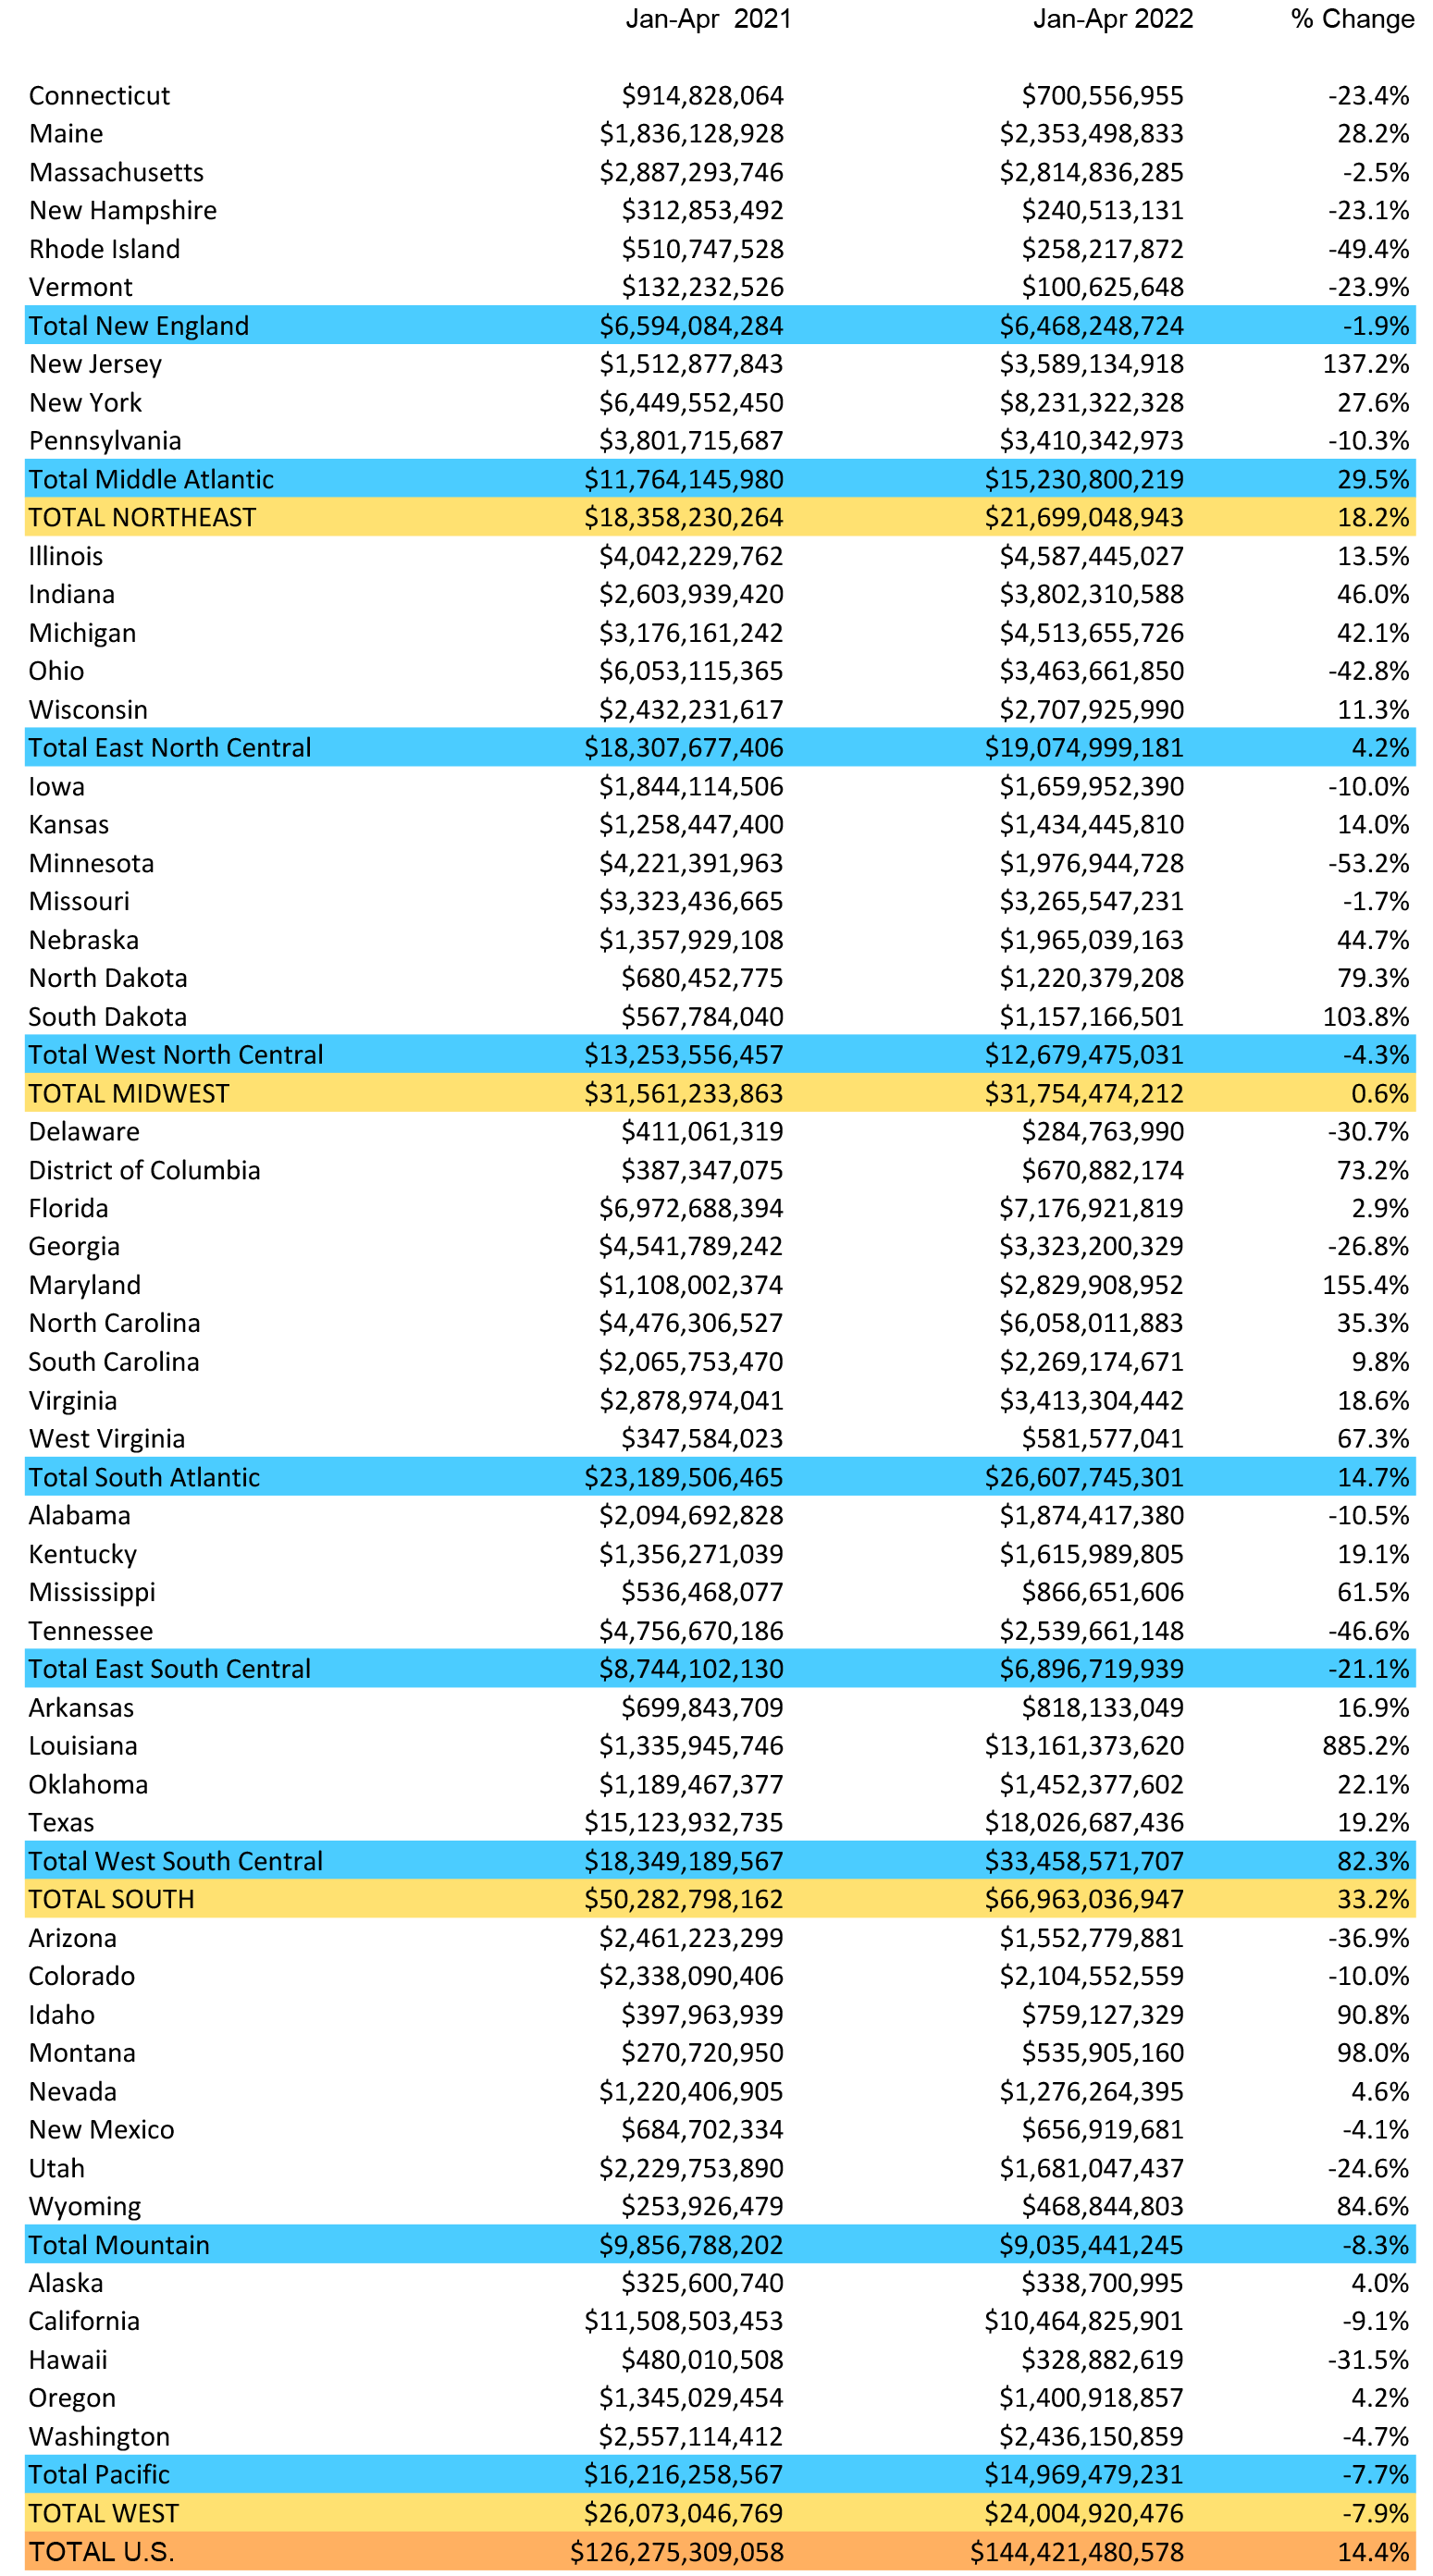
Data Source and Table: ConstructConnect.
Table 9:Value of United States National Construction Starts – April 2022 – ConstructConnect
Billions of current $s, not seasonally adjusted (NSA)

*Figures above are comprised of nonres building and engineering (i.e., residential is omitted).
Data Source and Table: ConstructConnect


Responses